|
|
Post by oldwarhorse on Jan 14, 2016 23:25:51 GMT
Did I ever say that our GE results in the borough of Stockton were counted by polling district and wards and then added together to give the result? I can probably still get them from my external hard drive over the weekend if anyone is curious We had local elections on the same day so it can make for an interesting comparison. Yes I'd be very interested to see these especially as with the strength of Independents in so many of the wards it can make extrapolating very difficult. A complete map of the borough by polling district would be interesting to see I will find the spreadsheet over the weekend and mail it to you. I don't do maps but I expect you could Sent from my GT-I9195 using proboards |
|
|
|
Post by Pete Whitehead on Jan 14, 2016 23:41:32 GMT
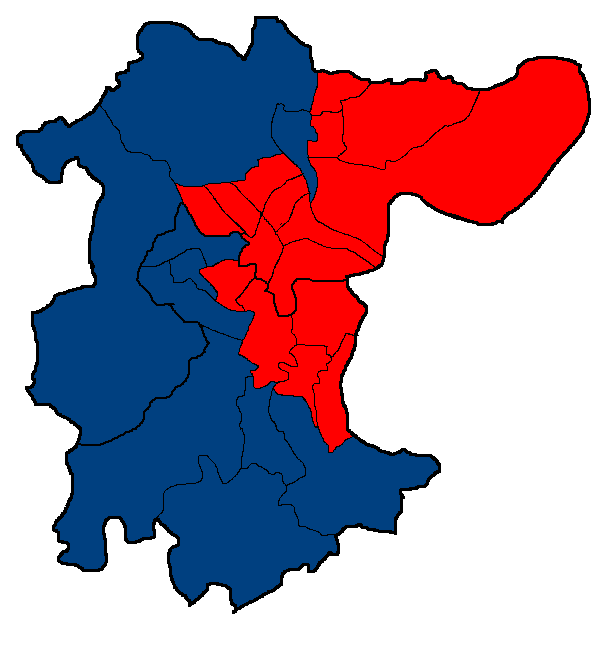
Great thanks. If you have a polling districts map (with key) I will certainly colour it in  (can't find anything online) |
|
|
|
Post by Andrew_S on Jan 14, 2016 23:53:41 GMT
Did I ever say that our GE results in the borough of Stockton were counted by polling district and wards and then added together to give the result? I can probably still get them from my external hard drive over the weekend if anyone is curious We had local elections on the same day so it can make for an interesting comparison. I thought it was a legal requirement to mix votes from different wards before counting them and therefore it isn't possible to get a ward breakdown? |
|
|
|
Post by Davıd Boothroyd on Jan 15, 2016 0:05:42 GMT
Did I ever say that our GE results in the borough of Stockton were counted by polling district and wards and then added together to give the result? I can probably still get them from my external hard drive over the weekend if anyone is curious We had local elections on the same day so it can make for an interesting comparison. I thought it was a legal requirement to mix votes from different wards before counting them and therefore it isn't possible to get a ward breakdown? The regulations say that the ballot papers from one box must be mixed with the ballot papers from another box. So as long as there is more than one ballot box (polling district) in each ward, the Returning Officer could make sure that they are only mixed with others from the same ward; and there's no rule prohibiting providing a local breakdown. |
|
Deleted
Deleted Member
Posts: 0
|
Post by Deleted on Jan 15, 2016 0:11:16 GMT
I thought it was a legal requirement to mix votes from different wards before counting them and therefore it isn't possible to get a ward breakdown? The regulations say that the ballot papers from one box must be mixed with the ballot papers from another box. So as long as there is more than one ballot box (polling district) in each ward, the Returning Officer could make sure that they are only mixed with others from the same ward; and there's no rule prohibiting providing a local breakdown. In that case, I say hurrah to the returning officer in Stockton! Why can't they all be that helpful? Perhaps we on this forum should all apply to be returning officers, it'd save Pete a lot of time number crunching. |
|
|
|
Post by oldwarhorse on Jan 15, 2016 0:29:45 GMT
They only need to swap 50 votes. One bundle.
They counted the European votes in the same way but I didn't think to ask for the figures at the time.
Basically it cuts down on recounts etc because each ward is a mini count within the overall count.
|
|
|
|
Post by Andrew_S on Jan 15, 2016 0:41:40 GMT
They only need to swap 50 votes. One bundle. They counted the European votes in the same way but I didn't think to ask for the figures at the time. Basically it cuts down on recounts etc because each ward is a mini count within the overall count. One idea is that anyone who's interested in calculating ward results could test out their methods by doing it for Stockton South before looking at the actual results which you have.  |
|
|
|
Post by Pete Whitehead on Jan 15, 2016 0:54:58 GMT
They only need to swap 50 votes. One bundle. They counted the European votes in the same way but I didn't think to ask for the figures at the time. Basically it cuts down on recounts etc because each ward is a mini count within the overall count. One idea is that anyone who's interested in calculating ward results could test out their methods by doing it for Stockton South before looking at the actual results which you have.  Which is precisely what I intend to do (and for Stockton North). Of course Stockton SOuth does present particular difficulties as mentioned because of the dominance in local elections by various Resident associations in Yarm, Ingleby Barwick and Thornaby so any notional results I produced were always going to be subject to a significant MOE. More interesting perhaps is to make comparisons in areas where this is not a factor such as I was able to do in for example Portsmouth South |
|
|
|
Post by Pete Whitehead on Jan 15, 2016 14:02:34 GMT
They only need to swap 50 votes. One bundle. They counted the European votes in the same way but I didn't think to ask for the figures at the time. Basically it cuts down on recounts etc because each ward is a mini count within the overall count. One idea is that anyone who's interested in calculating ward results could test out their methods by doing it for Stockton South before looking at the actual results which you have.  So - a slightly rushed and half arsed effort  | Stockton North | Con | Lab | LD | UKIP | | | | | | | | Billingham Central | 18.8% | 56.4% | 2.4% | 20.8% | | Billingham East | 16.6% | 59.3% | 2.1% | 20.4% | | Billingham North | 29.0% | 44.7% | 2.1% | 22.7% | | Billingham South | 21.3% | 53.0% | 2.3% | 21.9% | | Billingham West | 44.1% | 37.5% | 1.9% | 15.0% | | Hardwick | 17.3% | 57.1% | 2.1% | 21.9% | | Newtown | 20.0% | 54.3% | 2.2% | 22.0% | | Northern Parishes | 59.5% | 26.0% | 2.1% | 11.1% | | Norton North | 22.0% | 55.0% | 2.4% | 19.0% | | Norton South | 20.3% | 52.6% | 2.5% | 23.1% | | Norton West | 37.8% | 45.1% | 2.2% | 13.4% | | Roseworth | 17.6% | 59.7% | 2.2% | 18.8% | | Stockton Town Centre | 16.9% | 60.1% | 2.5% | 18.8% | | Western Parishes | 55.8% | 22.7% | 2.7% | 17.5% | | | | | | | | Stockton South | | | | | | | | | | | | Bishopsgarth and Elm Tree | 44.2% | 36.8% | 7.7% | 8.0% | | Eaglescliffe | 60.6% | 22.4% | 5.2% | 9.0% | | Fairfield | 54.1% | 32.2% | 1.4% | 9.5% | | Grangefield | 38.6% | 49.3% | 1.3% | 7.6% | | Hartburn | 63.4% | 26.6% | 1.7% | 5.6% | | Ingleby Barwick East | 51.6% | 29.7% | 2.6% | 13.2% | | Ingleby Barwick West | 50.5% | 31.4% | 2.4% | 12.8% | | Mandale and Victoria | 22.8% | 59.7% | 2.0% | 12.1% | | Parkfield and Oxbridge | 33.9% | 52.0% | 1.1% | 9.8% | | Stainsby Hill | 22.6% | 56.9% | 1.7% | 15.4% | | Village | 31.8% | 49.3% | 2.0% | 13.8% | | Yarm | 59.8% | 25.4% | 1.5% | 10.6% |
|
|
|
|
Post by Pete Whitehead on Jan 15, 2016 14:27:33 GMT
|
|
|
|
Post by Pete Whitehead on Jan 17, 2016 11:09:28 GMT
I have now received the detailed figures from oldwarhorse for which I am most grateful. Comparisons are most interesting. Below my own figures repeated on the left with the 'actual' figures on the right | Stockton North | Con | Lab | LD | UKIP | Stockton North | Con | Lab | LD | UKIP | | | | | | | | | | | | | Billingham Central | 18.8% | 56.4% | 2.4% | 20.8% | Billingham Central | 24.7% | 51.3% | 2.4% | 19.8% | | Billingham East | 16.6% | 59.3% | 2.1% | 20.4% | Billingham East | 21.6% | 56.2% | 1.2% | 19.3% | | Billingham North | 29.0% | 44.7% | 2.1% | 22.7% | Billingham North | 30.1% | 46.4% | 2.2% | 19.6% | | Billingham South | 21.3% | 53.0% | 2.3% | 21.9% | Billingham South | 25.1% | 48.7% | 1.8% | 22.4% | | Billingham West | 44.1% | 37.5% | 1.9% | 15.0% | Billingham West | 37.2% | 41.2% | 2.1% | 18.4% | | Hardwick | 17.3% | 57.1% | 2.1% | 21.9% | Hardwick | 20.4% | 56.9% | 1.7% | 19.7% | | Newtown | 20.0% | 54.3% | 2.2% | 22.0% | Newtown | 20.2% | 54.6% | 2.3% | 21.4% | | Northern Parishes | 59.5% | 26.0% | 2.1% | 11.1% | Northern Parishes | 44.8% | 35.3% | 3.4% | 14.5% | | Norton North | 22.0% | 55.0% | 2.4% | 19.0% | Norton North | 26.3% | 50.2% | 3.1% | 18.9% | | Norton South | 20.3% | 52.6% | 2.5% | 23.1% | Norton South | 22.6% | 52.0% | 2.8% | 21.5% | | Norton West | 37.8% | 45.1% | 2.2% | 13.4% | Norton West | 38.6% | 42.2% | 3.0% | 15.3% | | Roseworth | 17.6% | 59.7% | 2.2% | 18.8% | Roseworth | 21.4% | 59.5% | 1.0% | 17.0% | | Stockton Town Centre | 16.9% | 60.1% | 2.5% | 18.8% | Stockton Town Centre | 14.8% | 63.0% | 2.0% | 18.6% | | Western Parishes | 55.8% | 22.7% | 2.7% | 17.5% | Western Parishes | 53.2% | 26.4% | 3.1% | 16.1% | | | | | | | | | | | | | Stockton South | | | | | Stockton South | | | | | | | | | | | | | | | | | Bishopsgarth and Elm Tree | 44.2% | 36.8% | 7.7% | 8.0% | Bishopsgarth and Elm Tree | 49.9% | 34.5% | 2.6% | 11.1% | | Eaglescliffe | 60.6% | 22.4% | 5.2% | 9.0% | Eaglescliffe | 53.1% | 31.1% | 3.6% | 9.2% | | Fairfield | 54.1% | 32.2% | 1.4% | 9.5% | Fairfield | 49.9% | 33.0% | 2.4% | 12.3% | | Grangefield | 38.6% | 49.3% | 1.3% | 7.6% | Grangefield | 46.2% | 38.7% | 2.8% | 9.9% | | Hartburn | 63.4% | 26.6% | 1.7% | 5.6% | Hartburn | 54.1% | 32.3% | 2.0% | 9.7% | | Ingleby Barwick East | 51.6% | 29.7% | 2.6% | 13.2% | Ingleby Barwick East | 51.9% | 32.6% | 2.3% | 10.8% | | Ingleby Barwick West | 50.5% | 31.4% | 2.4% | 12.8% | Ingleby Barwick West | 50.2% | 33.5% | 3.2% | 10.3% | | Mandale and Victoria | 22.8% | 59.7% | 2.0% | 12.1% | Mandale and Victoria | 25.3% | 54.0% | 2.3% | 12.1% | | Parkfield and Oxbridge | 33.9% | 52.0% | 1.1% | 9.8% | Parkfield and Oxbridge | 29.1% | 55.2% | 2.0% | 10.6% | | Stainsby Hill | 22.6% | 56.9% | 1.7% | 15.4% | Stainsby Hill | 25.1% | 55.2% | 0.9% | 13.9% | | Village | 31.8% | 49.3% | 2.0% | 13.8% | Village | 32.6% | 47.0% | 1.7% | 13.5% | | Yarm | 59.8% | 25.4% | 1.5% | 10.6% | Yarm | 59.7% | 27.6% | 3.3% | 6.8% |
So in terms of which wards were carried we agree on all but two : Billingham West which I have as Tory and Grangefield which I have as Labour. My figures for the Thornaby wards and (especially) Ingleby Barwick are pretty close considering the complications caused by Independents there. In general the figures from Louise's spreadsheet show a general levelling in almost all wards with the strong Labour wards being less strong on the second set of figures and the strong Tory wards less strongly Tory. this is particularly marked in the case of Northern Parishes ward and also by comparing the neighbouring wards of Grangefield and Hartburn in Stockton South - the one Labour held and the other a very safe Tory ward. On the second set of figures there is not all that great a difference between the two whereas on mine there is. Also notable is the levelling effect on the LD vote such that in Bishopsgarth & Elm Tree they are performing no better than average despite still returning a councillor there in the local elections. There is however a rather glaring caveat..... tbc |
|
|
|
Post by Pete Whitehead on Jan 17, 2016 11:34:06 GMT
Unfortunately all is not as it appears. As soon as I looked at comparing the actual number of votes cast for each party in each ward there were some glaring discrepancies. I was at first concerned that I had made some grievous error in my own calculations but this is not the case. It is evident that the postal votes from each ward were mixed up and distributed, somewhat unevenly, amongst other random boxes. This would explain the levelling effect described above, particularly in the case of Northern Parishes where a large proportion of the votes assigned to that ward are actually postal votes from other wards (which by definition would be more Labour inclined than those from Northern Parishes). To illustrate the point the table below shows the following: Column A is the electorate for each ward from the December 2011 spreadsheet (the most recent list I have of parliamentary electorates) B is the local government electorate for each ward taken from www.stockton.gov.uk/stockton-council/elections-and-voting/elections/district-election-results-2015/C is the turnout in the local elections taken from the same source D is an extrapoltaion from B & C of the number of votes cast in each ward in the general election E is the total number of votes cast in each ward according to the spreadsheet from OWH F is the implied turnout in each ward based on B and E | | A | B | C | D | E | F | | | | | | | | | | Billingham Central | 5267 | 5260 | 57.3% | 3009 | 3778 | 71.8% | | Billingham East | 5321 | 5179 | 51.9% | 2686 | 4643 | 89.7% | | Billingham North | 7324 | 7086 | 66.7% | 4723 | 6015 | 84.9% | | Billingham South | 4972 | 4801 | 57.1% | 2736 | 2559 | 53.3% | | Billingham West | 4828 | 4629 | 69.8% | 3229 | 2740 | 59.2% | | Hardwick | 4842 | 4882 | 51.6% | 2516 | 2367 | 48.5% | | Newtown | 4954 | 4957 | 48.7% | 2412 | 2149 | 43.4% | | Northern Parishes | 2695 | 2974 | 71.0% | 2108 | 2649 | 89.1% | | Norton North | 5036 | 4910 | 57.8% | 2834 | 2805 | 57.1% | | Norton South | 4896 | 4643 | 59.1% | 2741 | 2577 | 55.5% | | Norton West | 5206 | 5152 | 72.5% | 3733 | 2458 | 47.7% | | Roseworth | 5156 | 5045 | 56.1% | 2829 | 1985 | 39.3% | | Stockton Town Centre | 4206 | 4351 | 48.5% | 2107 | 1496 | 34.4% | | Western Parishes | 2630 | 2694 | 70.7% | 1907 | 1350 | 50.1% | | | | | | | | | | Bishopsgarth and Elm Tree | 5304 | 5124 | 71.0% | 3664 | 6203 | 121.1% | | Eaglescliffe | 8288 | 8216 | 75.2% | 6222 | 7120 | 86.7% | | Fairfield | 4837 | 4649 | 72.6% | 3399 | 4190 | 90.1% | | Grangefield | 5324 | 5260 | 73.2% | 3877 | 3593 | 68.3% | | Hartburn | 5480 | 5380 | 75.9% | 4112 | 3385 | 62.9% | | Ingleby Barwick East | 7498 | 7697 | 69.1% | 5356 | 6018 | 78.2% | | Ingleby Barwick West | 7457 | 8306 | 69.2% | 5788 | 6879 | 82.8% | | Mandale and Victoria | 7557 | 7650 | 53.4% | 4114 | 3716 | 48.6% | | Parkfield and Oxbridge | 4953 | 5341 | 62.1% | 3340 | 2496 | 46.7% | | Stainsby Hill | 4835 | 4865 | 57.2% | 2802 | 2167 | 44.5% | | Village | 5232 | 5382 | 62.8% | 3404 | 2317 | 43.1% | | Yarm | 7756 | 7552 | 75.2% | 5719 | 3713 | 49.2% |
I think it is not unfair to suggest that the figures in columns E and F seem implausible and that all the results are skewed either by the absence of their own postal votes or the inclusion of postal votes from other wards with different voting patterns or both. I think incidentally the same issue applies with regards to Bristol West where some figures appeared on UKPR and were cited here which claimed to show Labour carrying Clifton. I expressed some doubts about the great difference between the reported Tory vote in the Clifton wards and their local election support and I take it that a similar phenomenon there would have explained that (ie that a large number of postal Tory votes from Clifton ended up in the boxes from other wards while those from other wards got counted with the Clifton boxes. I'd be interested in the thoughts of others about this as I have often heard people saying they carried this or that ward but if there are significant numbers of postal votes I don't know how you can be so sure when its close (for example Khunanup has told me about a couple of wards in Portsmouth which the Lib Dems narrowly carried this year and iainbhx likewise re: the wards in Birmingham Hall Green in 2010) |
|
|
|
Post by afleitch on Jan 17, 2016 21:58:39 GMT
It's a shame about the postal votes. In the Holyrood data in 2007 because of the electronic counting, the postal votes were kept separate but inputed as one figure for the whole constituency. I apportioned them by wards afterwards (based on the strength of the party vote in each ward). At that time, I noticed that the Lib Dem vote was so uniform that they won every ward in every seat they held, so it may well be that a uniform decline within constituencies, might lead to a similar result.
|
|
|
|
Post by Pete Whitehead on Jan 28, 2016 20:26:08 GMT
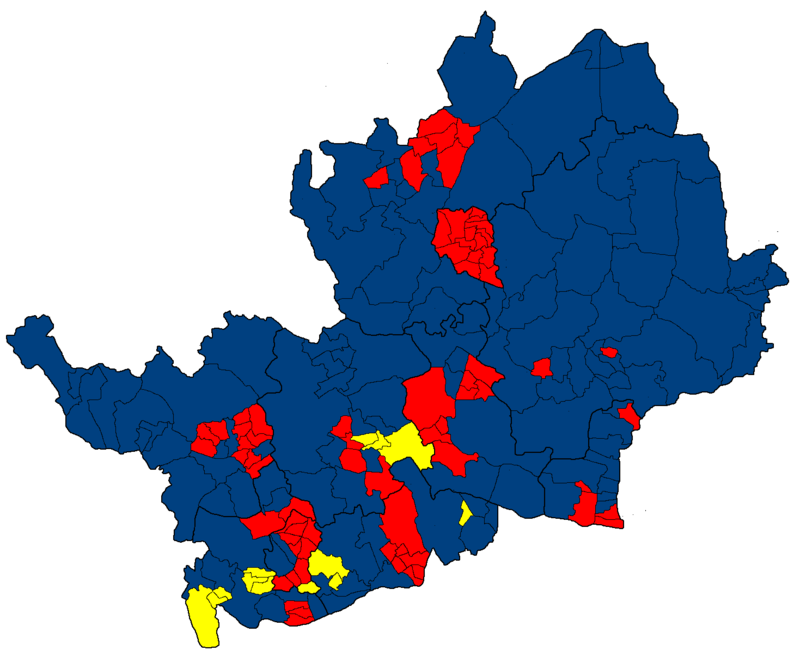
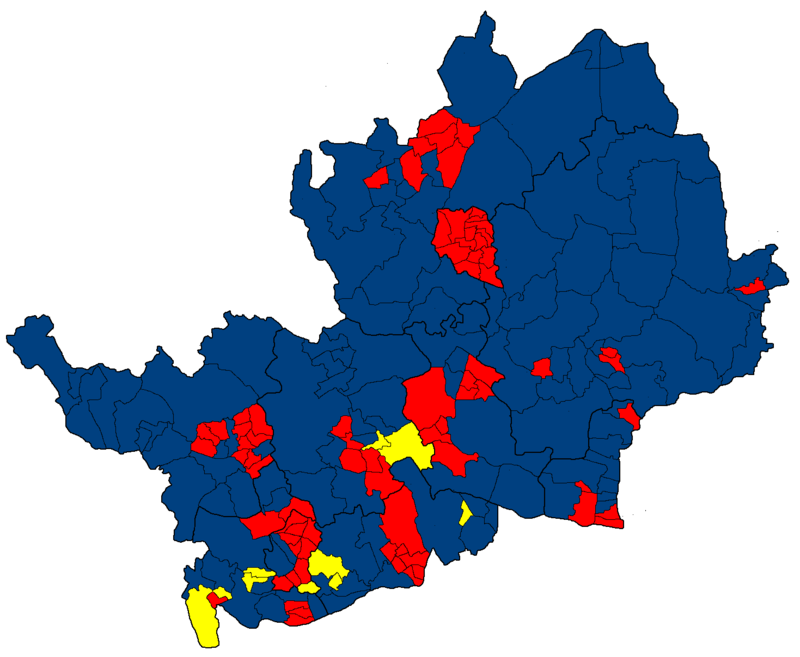
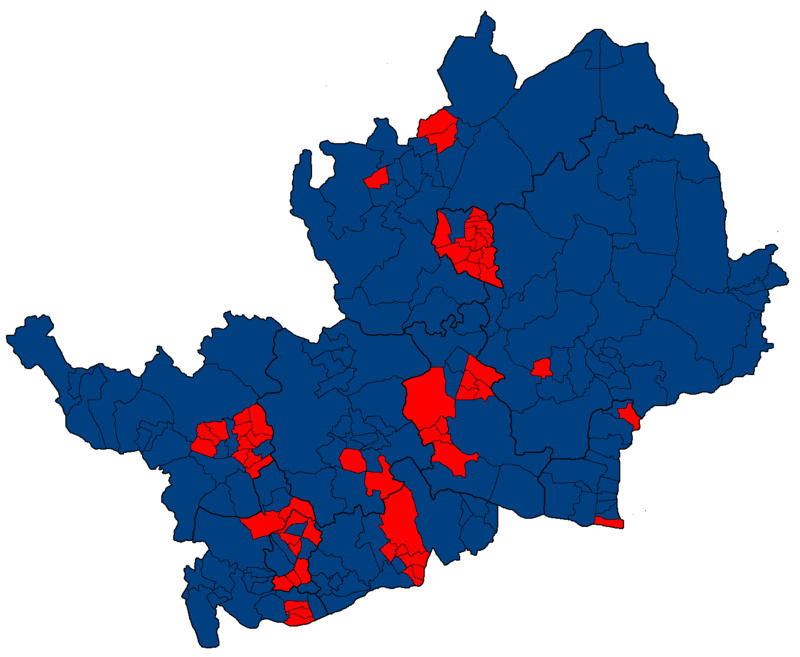
February 1974  October 1974  1979  |
|
|
|
Post by Pete Whitehead on Jan 28, 2016 20:29:01 GMT
|
|
|
|
Post by afleitch on Jan 28, 2016 20:38:27 GMT
Fantastic work. 1983 is going to look amazing in huge swathes of the country.
|
|
Georg Ebner
Non-Aligned
Roman romantic reactionary Catholic
Posts: 9,800 
|
Post by Georg Ebner on Feb 5, 2016 0:11:13 GMT
February 1974  October 1974  1979  Wonderful work as always, thank You Pete! (I hadn't expected You to make Herts first...) But isn't this thread the wrong place? |
|
|
|
Post by Pete Whitehead on Feb 5, 2016 8:26:10 GMT
Wonderful work as always, thank You Pete! (I hadn't expected You to make Herts first...) But isn't this thread the wrong place? Admittedly it is a bit off-topic as far as 2015 notional results go but it didn't seem worth a new thread and there wasn't a better existing thread to put them in (Pretty maps I suppose could have done). I don't necessarily envisage doing many (any?) other areas back to 1974 though if I had all the time in the world I probably would. I did Hertfordshire because it is my own area and I always devote a bit more time and attention to it |
|
|
|
Post by afleitch on Feb 6, 2016 18:37:36 GMT
Wonderful work as always, thank You Pete! (I hadn't expected You to make Herts first...) But isn't this thread the wrong place? Admittedly it is a bit off-topic as far as 2015 notional results go but it didn't seem worth a new thread and there wasn't a better existing thread to put them in (Pretty maps I suppose could have done). I don't necessarily envisage doing many (any?) other areas back to 1974 though if I had all the time in the world I probably would. I did Hertfordshire because it is my own area and I always devote a bit more time and attention to it What 'notionals' (1983-1992 boundaries) did you get for 74 and especially 1979 in the seats within Herts? Would be interesting to see how the compare with the published ones. |
|
|
|
Post by Pete Whitehead on Feb 6, 2016 20:23:43 GMT
Of course I've done that particular exercise previously but the results will differ somewhat. I shall return later..
|
|