|
|
Post by Pete Whitehead on May 18, 2015 21:28:08 GMT
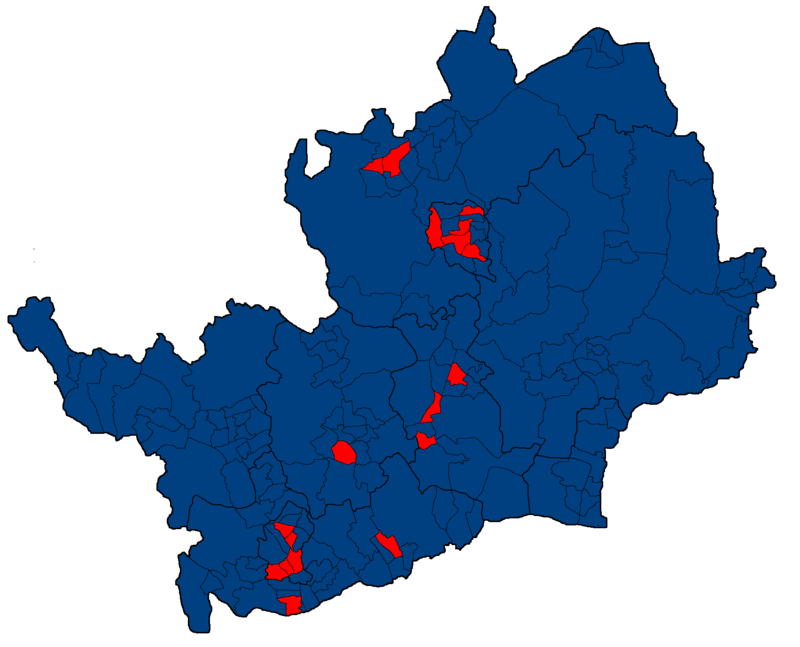
The first of (hopefully) many - Hertfordshire naturally  Changes from 2010 are in some cases confused by boundary changes but are asa follows: Conservative gain from Labour Bandley Hill, Chells, Roebuck (all in Stevenage) Labour gain from Conservative Hitchin Bearton, Hatfield Central, Hatfield South, Peartree (Welwyn Garden City) Labour gain from LD Sopwell (St Albans) Conservative gain from LD Ashley, Clarence, Colney Heath, Cunningham, St Peters (all in St Albans). Oxhey, Stanborough, Woodside (Watford). Durrants (Croxley Green), Abbots Langley & Bedmond, Gade Valley, Leavesden (Three Rivers) The only settlement of any size in Hertfordshire to be carried by other than the Conservative party was South Oxhey. Of the 77 county council divisions the Conservatives would have won 72 with Labour winning 2 in Stevenage (Bedwell and Shephall), 2 in Watford (Callowland Leggatts and Vicarage Holywell) and 1 in Three Rivers (South Oxhey) Labour would not however have carried South Oxhey on the boundaries which are proposed for the next county council elections. |
|
|
|
Post by Pete Whitehead on May 18, 2015 21:33:55 GMT
|
|
iain
Lib Dem
Posts: 11,427 
|
Post by iain on May 18, 2015 21:38:04 GMT
There seems to be a problem with the boundaries in Three Rivers?
But great work!!
|
|
|
|
Post by Pete Whitehead on May 18, 2015 21:55:36 GMT
The problem being they were redrawn since the parliamentary boundaries were last drawn up. This has left four of the wards in that borough split between constituencies - 2 in the south east split between Watford and SW Herts and 2 in the North east split between Watford and St Albans. The lines on the maps show both the ward boundaries and the constituency boundaries in those areas (I perforated the constituency boundary in the Watford Rural bit but not in the Abbots bit)
|
|
|
|
Post by manchesterman on May 19, 2015 4:00:53 GMT
The prospect of seeing such maps with the ward results for the whole of the UK makes me positively salivate. Thanks a million Pete!  |
|
Harry Hayfield
Green
Cavalier Gentleman (as in 17th century Cavalier)
Posts: 2,922 
|
Post by Harry Hayfield on May 19, 2015 9:01:16 GMT
How on earth are you generating these maps (and I'd love to see what you come up with for Wales)? Will you be creating spreadsheets as well for those of us who like them?
|
|
iain
Lib Dem
Posts: 11,427 
|
Post by iain on May 26, 2015 12:50:47 GMT
Here's Sheffield Hallam:
SHEFFIELD HALLAM
Lib Dem - 22,215 (40.04%)
Labour - 19,862 (35.80%)
Conservative - 7,544 (13.60%)
UKIP - 3,575 (6.44%)
Green - 1,772 (3.19%)
Other - 513 (0.92%)
Crookes
Labour - 5,109 (47.17%)
Lib Dem - 3,345 (30.89%)
Conservative - 1,110 (10.25%)
UKIP - 611 (5.64%)
Green - 501 (4.63%)
Other - 154 (1.42%)
Dore & Totley
Lib Dem - 5,091 (46.70%)
Labour - 2,670 (24.49%)
Conservative - 2,223 (20.39%)
UKIP - 676 (6.20%)
Green - 188 (1.72%)
Other - 53 (0.49%)
Ecclesall
Lib Dem - 4,706 (39.55%)
Labour - 4,306 (36.19%)
Conservative - 1,709 (14.36%)
UKIP - 557 (4.68%)
Green - 494 (4.15%)
Other - 127 (1.07%)
Fulwood
Lib Dem - 4,992 (45.73%)
Labour - 3,511 (32.16%)
Conservative - 1,493 (13.68%)
UKIP - 458 (4.20%)
Green - 385 (3.53%)
Other - 78 (0.71%)
Stannington
Labour - 4,266 (39.02%)
Lib Dem - 4,081 (37.32%)
UKIP - 1,273 (11.64%)
Conservative - 1,009 (9.23%)
Green - 204 (1.87%)
Other - 101 (0.92%)
SHEFFIELD CENTRAL
Labour - 18,167 - 24,308
Green - 13,574 - 6,999
Lib Dem - 5,018 - 4,278
Conservative - 3,968 - 4,917
UKIP - 3,489 - 3,296
TUSC - 566 - 375
Broomhill
Labour - 3,701 (46.71%)
Green - 1,681 (21.22%)
Conservative - 1,301 (16.42%)
Lib Dem - 916 (11.56%)
UKIP - 278 (3.51%)
Other - 46 (0.58%)
Central
Labour - 5,319 (58.16%)
Green - 2,027 (22.17%)
Conservative - 1,048 (11.46%)
Lib Dem - 391 (4.28%)
UKIP - 294 (3.21%)
Other - 66 (0.72%)
Manor Castle
Labour - 4,943 (67.21%)
UKIP - 1,157 (15.73%)
Conservative - 591 (8.04%)
Green - 330 (4.49%)
Lib Dem - 267 (3.63%)
Other - 67 (0.91%)
Nether Edge
Labour - 4,972 (49.83%)
Green - 1,776 (17.80%)
Lib Dem - 1,513 (15.16%)
Conservative - 1,088 (10.90%)
UKIP - 533 (5.34%)
Other - 96 (0.96%)
Walkley
Labour - 5,373 (54.98%)
Lib Dem - 1,191 (12.19%)
Green - 1,185 (12.13%)
UKIP - 1,034 (10.58%)
Conservative - 889 (9.10%)
Other - 100 (1.02%)
|
|
|
|
Post by Pete Whitehead on May 27, 2015 16:51:41 GMT
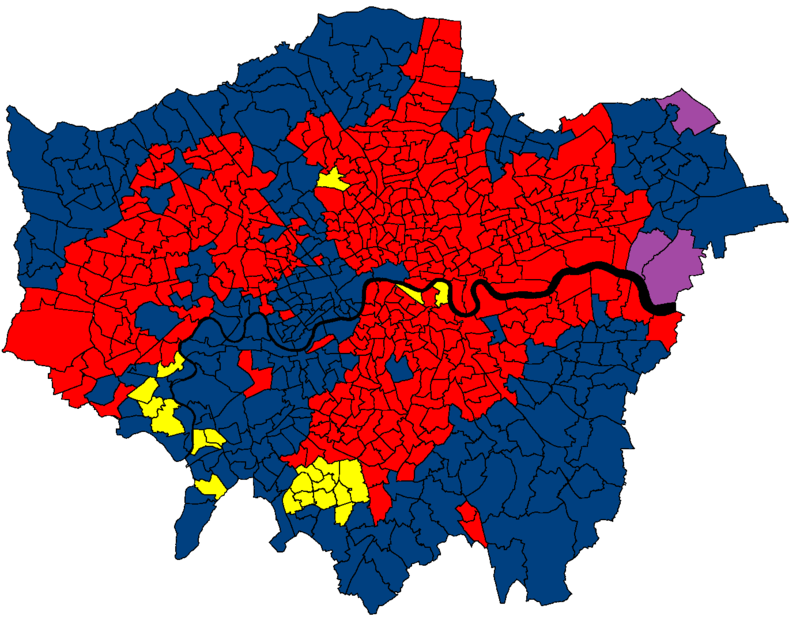
 Changes from 2010 Lab Gain from Con (21) Redbridge: Aldborough, Barkingside, Clayhall, Hainault, Wanstead. Waltham Forest: Hale End & Highams Park Tower Hamlets: Blackwall & Cubitt Town, Millwall Hammersmith & Fulham: North End Barnet: Coppetts Brent: Northwick Park Ealing: Cleveland Hillingdon: West Drayton Hounslow: Bedfont, Feltham North, Feltham West, Hanworth, Hounslow South. Wandsworth: Roehampton & Putney Heath Croydon: Waddon Bromley: Clock House Lab Gain from LD (23) Haringey: Alexandra, Crouch End, Fortis Green, Hornsey, Muswell Hill, Stroud Green. Camden: West End Brent: Dollis Hill, Dudden Hill, Kensal Green, Mapesbury, Willesden Green Lambeth: St Leonards, Streatham Hill, Streatham Wells Southwark: Cathedrals, Chaucer, East Dulwich, East Walworth, Grange, Newington, Riverside, South Bermondsey Con Gain from LD (22) Camden: Fortune Green Brent: Brondesbury Park Ealing: Southfield Richmond: Ham & Petersham, Hampton, Hampton North, Heathfield, Kew, North Richmond, South Twickenham, Twickenham Riverside, Whitton Kingston: Alexandra, Berrylands, Beverley, Canbury, Chessington North, Chessington South, St Marks, Surbiton Hill Sutton: Stonecot Southwark: Village Con Gain from Lab (2) Harrow: Kenton West Wandsworth: Queenstown UKIP Gain from Con (3) Havering: Goosehays, Rainham & Werrington, South Hornchurch 11 Boroughs saw no wards changing hands. Barking, Newham, Hackney, Islington and Lewisham all remained 100% Labour while Enfield, Merton, Greenwich, Bexley, Kensington & Chelsea and Westminster had the same mix of Conservative and Labour wards as before |
|
|
|
Post by Pete Whitehead on May 27, 2015 16:55:11 GMT
|
|
iain
Lib Dem
Posts: 11,427 
|
Post by iain on May 27, 2015 20:05:19 GMT
What did you have for St Marks and Chessington South in Kingston, and Cathedrals in Southwark?
|
|
|
|
Post by Pete Whitehead on May 27, 2015 20:24:22 GMT
What the detailed results?
|
|
iain
Lib Dem
Posts: 11,427 
|
Post by iain on May 27, 2015 20:39:24 GMT
Yes - I only had a quick scan of the council results in 2014 compared with the constituency results in the GE, but I thought the LDs had narrowly carried these (IIRC).
|
|
|
|
Post by Pete Whitehead on May 27, 2015 20:54:42 GMT
Well I don't want to give away all my secrets  but very close in Cathedrals (too close to call really) Lab 2609 39.9% LD 2511 38.4% Con 787 12.0% UKIP 321 4.9% Grn 281 4.3% Oth 34 0.5% Chessington North & Hook Con 1778 38.1% LD 1624 34.8% Lab 604 12.9% UKIP 497 10.6% Grn 141 3.0% Oth 26 0.6% St Marks Con 1988 40.1% LD 1682 33.9% Lab 744 15.0% Grn 276 5.6% UKIP 238 4.8% Oth 32 0.6% |
|
|
|
Post by Davıd Boothroyd on May 31, 2015 21:17:22 GMT
 11 Boroughs saw no wards changing hands. Barking, Newham, Hackney, Islington and Lewisham all remained 100% Labour while Enfield, Merton, Greenwich, Bexley, Kensington & Chelsea and Westminster had the same mix of Conservative and Labour wards as before Are you sure about Westminster? There was a 0.7% swing from Conservative to Labour in Cities of London and Westminster between 2014 and 2015, and Labour was 4.7% ahead in Churchill ward in 2014. |
|
|
|
Post by Pete Whitehead on May 31, 2015 21:30:47 GMT
Can never be sure of course (without being at the count) and I have it very close - Tories only about 50 votes ahead so likely to be within MOR. I didn't just use the 2014 data here as the base though as in borough elections patterns of party competition can be patchy so I used some data from the 2012 GLA elections as well
|
|
|
|
Post by afleitch on Jun 1, 2015 18:03:49 GMT
Great series so far. I'm trying to do the same for Scotland, dealing with split wards and all.
|
|
Harry Hayfield
Green
Cavalier Gentleman (as in 17th century Cavalier)
Posts: 2,922 
|
Post by Harry Hayfield on Jun 9, 2015 13:19:34 GMT
How are you generating this data?
|
|
|
|
Post by Pete Whitehead on Jun 20, 2015 11:28:35 GMT
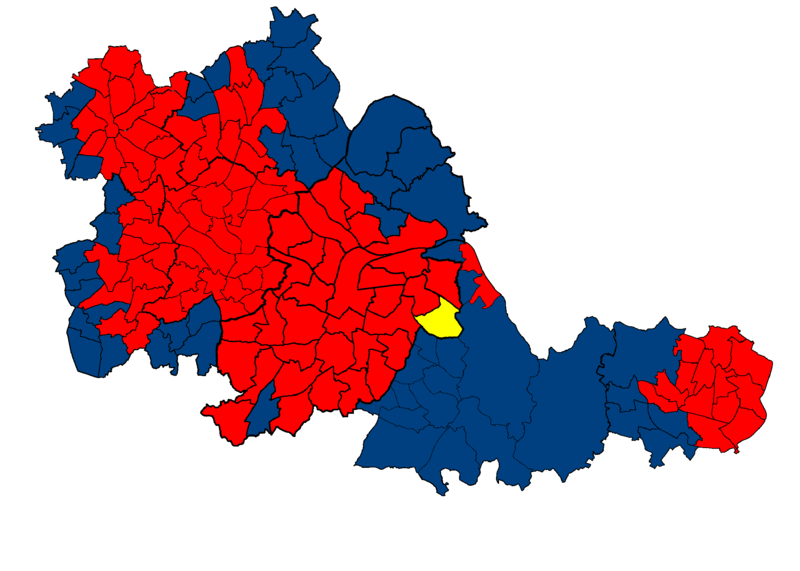
 Lab Gain from Con (10) Birmingham: Bourneville, Edgbaston, Harborne Dudley: Upper Gornal & Woodsetton Sandwell: Charlemont & Grove Vale, Wednesbury North Walsall: St Matthews Wolverhampton: Bushbury North, Wednesfield North, Wednesfield South Lab Gain from Lib Dem (6) Birmingham: Acocks Green, Moseley & Kings Heath, Perry Barr, Selly Oak, South Yardley, Stechfod & Yardley North Lab Gain from Respect (1) Birmingham: Sparkbrook Con Gain from Lib Dem (4) Solihull: Lyndon, Olton, Shirley South, Shirley West Con Gain from Lab (2) Birmingham: Northfield Coventry: Westwood |
|
|
|
Post by Pete Whitehead on Jun 20, 2015 11:32:10 GMT
|
|
iain
Lib Dem
Posts: 11,427 
|
Post by iain on Jun 20, 2015 12:02:44 GMT
 Lab Gain from Con (10) Birmingham: Bourneville, Edgbaston, Harborne Dudley: Upper Gornal & Woodsetton Sandwell: Charlemont & Grove Vale, Wednesbury North Walsall: St Matthews Wolverhampton: Bushbury North, Wednesfield North, Wednesfield South Lab Gain from Lib Dem (6) Birmingham: Acocks Green, Moseley & Kings Heath, Perry Barr, Selly Oak, South Yardley, Stechfod & Yardley North Lab Gain from Respect (1) Birmingham: Sparkbrook Con Gain from Lib Dem (4) Solihull: Lyndon, Olton, Shirley South, Shirley West Con Gain from Lab (2) Birmingham: Northfield Coventry: Westwood Did Labour really win Bartley Green, even in 2010?! Also surprised to see that you had Acocks Green Lib Dem in 2010 but Hall Green Labour. |
|