|
|
Post by minionofmidas on May 8, 2022 11:50:05 GMT
that does count as NOC. Thanks. but not as losing control - it was the inaugural election. Nice trick trivia question. |
|
|
|
Post by gwynthegriff on May 8, 2022 11:55:36 GMT
My experience of local elections in Croydon in 3-member wards is that the turnout is usually about 2.7 votes per ballot paper, and that almost all ballot papers have either 3 votes or 1 vote on them. Very few have 2 votes. That roughly works out as 15% plumping for 1 candidate. Very approximately. My experience in 2 member wards in Bath is probably about 10% overall, though much higher in wards where some of the parties have only one candidate. I've stood a few times as a lone Green candidate in 2 member wards and I would guess that at least 25% of my votes will be from voters just using one of their votes. Some voters will only vote once because they want to support a popular incumbent or someone who is well known locally, even when they have a running mate. In these cases, you sometimes find huge differences between the votes for one candidate and another from the same party. And there are always some who, despite plenty of information to tell them otherwise, think they only have one vote. In these cases, the candidate in the preferred party who comes first on the ballot paper normally benefits. It is also not unknown for a party running a single candidate to issue material stating voters may only vote for one candidate. It is also not unknown for the official notice at the polling station to state much the same. (Reusing the usual format for election by thirds for an all-out following boundary changes.) |
|
|
|
Post by batman on May 8, 2022 13:51:27 GMT
One voter in Richmond upon Thames told me that the polling clerk had told her she only had one vote and that therefore she had only cast one vote. I find that hard to believe. I don't know what her voting intention was, it wasn't mentioned.
|
|
|
|
Post by andrewp on May 8, 2022 14:02:36 GMT
One voter in Richmond upon Thames told me that the polling clerk had told her she only had one vote and that therefore she had only cast one vote. I find that hard to believe. I don't know what her voting intention was, it wasn't mentioned. As a polling clerk, I often think that my choice, and my colleagues choice of words around that, could influence the result in multi member contests, and the training doesn’t overtly mention, what in my opinion is quite an important point. I spent Thursday saying 300 times, here is the unitary paper and there are 6 candidates and you can vote for up to 2,and here is the town council paper and there are 4 candidates and you can vote for up to 2, I didn’t specifically get told to say that though. The town council election had 2x Lab candidates, 1x Con and 1x LD for 2 seats. At least half a dozen people during the day called back to me from the booth ‘ do I have to vote for 2?’. |
|
jamie
Top Poster

Posts: 6,842 
|
Post by jamie on May 8, 2022 16:32:12 GMT
What is Labour’s current policy on AWS, particularly when a female MP retires (i seem to remember there were exceptions to an automatic AWS in a few cases in 2019 but may be wrong)?
|
|
andrea
Non-Aligned
Posts: 7,071
|
Post by andrea on May 8, 2022 16:35:18 GMT
What is Labour’s current policy on AWS, particularly when a female MP retires (i seem to remember there were exceptions to an automatic AWS in a few cases in 2019 but may be wrong)? They will not use AWS for selections in this parliament. Legal advices to the NEC indicated that now that 51% of Labour MPs are women, AWS could be challenged in court. |
|
|
|
Post by froome on May 10, 2022 8:40:44 GMT
A quick look through the Defections thread shows many councillors either becoming Independent or joining parties after having been Independent. Which made me wonder if anyone has ever attempted to calculate what percentage of councillors:
a) Defect at some point during their time as a councillor?
b) Independent councillors become a representative of a political party at some time as a councillor?
c) Party councillors become an Independent representative at some time as a councillor?
d) At what point during their time as a councillor do most defectees defect? Obviously many do so just before finally deciding to give up, but perhaps a lot of others don't.
|
|
|
|
Post by Pete Whitehead on May 10, 2022 9:19:14 GMT
A quick look through the Defections thread shows many councillors either becoming Independent or joining parties after having been Independent. Which made me wonder if anyone has ever attempted to calculate what percentage of councillors: a) Defect at some point during their time as a councillor? b) Independent councillors become a representative of a political party at some time as a councillor? c) Party councillors become an Independent representative at some time as a councillor? d) At what point during their time as a councillor do most defectees defect? Obviously many do so just before finally deciding to give up, but perhaps a lot of others don't. The most common cause seems not to be that they've decided to give up but that their party has decided not to reselect them |
|
|
|
Post by islington on May 10, 2022 9:28:56 GMT
My experience of local elections in Croydon in 3-member wards is that the turnout is usually about 2.7 votes per ballot paper, and that almost all ballot papers have either 3 votes or 1 vote on them. Very few have 2 votes. That roughly works out as 15% plumping for 1 candidate. Very approximately. My experience in 2 member wards in Bath is probably about 10% overall, though much higher in wards where some of the parties have only one candidate. I've stood a few times as a lone Green candidate in 2 member wards and I would guess that at least 25% of my votes will be from voters just using one of their votes. Some voters will only vote once because they want to support a popular incumbent or someone who is well known locally, even when they have a running mate. In these cases, you sometimes find huge differences between the votes for one candidate and another from the same party. And there are always some who, despite plenty of information to tell them otherwise, think they only have one vote. In these cases, the candidate in the preferred party who comes first on the ballot paper normally benefits. All grist to my advocacy of single-member wards (and all-off elections) at LA level. (prepares to duck) |
|
|
|
Post by jm on May 10, 2022 12:13:20 GMT
Heard there were only 3 councils in the 1990s that stayed in overall Conservative control - Huntingdonshire, Wokingham, and Runnymede. Is this true? Don't know whether you're including county councils. I think Bucks stayed Tory the whole time. Here is a map of the results of the 1995 local elections from Wikipedia (excludes County councils) 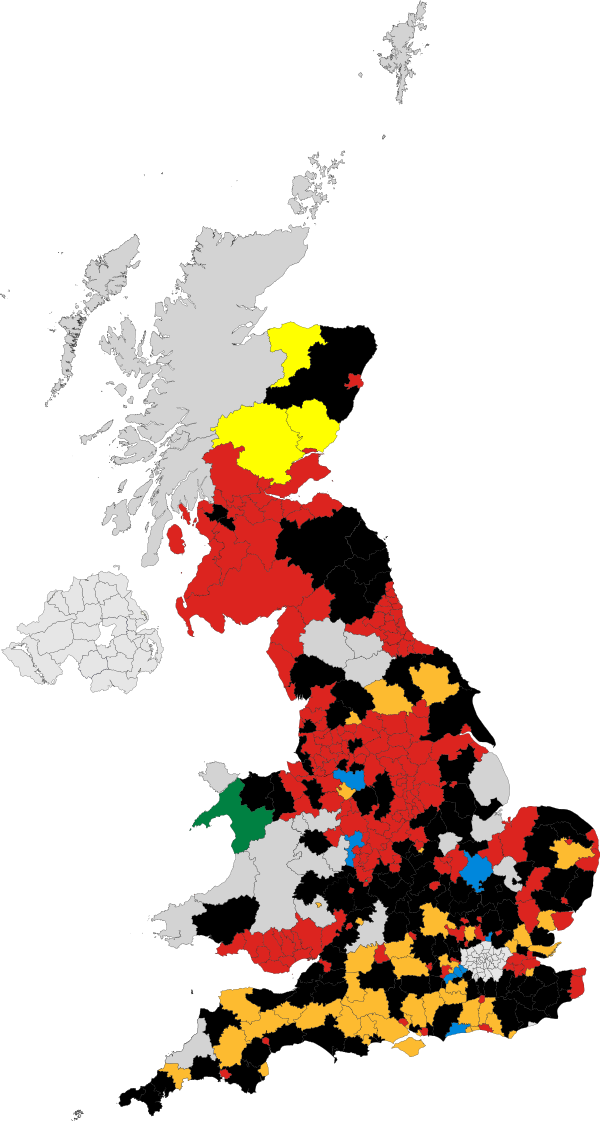 |
|
jw
Non-Aligned
Posts: 26
|
Post by jw on May 15, 2022 13:08:14 GMT
Can anyone help me with pre-1964 local results for any or all of the three Boroughs that went to make up Waltham Forest - Chingford, Walthamstow and Leyton.
|
|
|
|
Post by LDCaerdydd on May 26, 2022 11:48:38 GMT
When calculating local election vote totals for multi member wards which is better:
- only including the top vote
- including all votes
Personally I would say the later, if there’s a two member ward every voter has up to two votes, so why would we not include all of them?
I’ve noticed on Wikipedia totals are mainly but not exclusively calculated using the top vote method.
|
|
|
|
Post by johnloony on May 26, 2022 11:50:13 GMT
When calculating local election vote totals for multi member wards which is better: - only including the top vote - including all votes Personally I would say the later, if there’s a two member ward every voter has up to two votes, so why would we not include all of them? I’ve noticed on Wikipedia totals are mainly but not exclusively calculated using the top vote method. I use the average for each party. |
|
|
|
Post by andrewp on May 26, 2022 12:02:25 GMT
When calculating local election vote totals for multi member wards which is better: - only including the top vote - including all votes Personally I would say the later, if there’s a two member ward every voter has up to two votes, so why would we not include all of them? I’ve noticed on Wikipedia totals are mainly but not exclusively calculated using the top vote method. I use the top vote. It obviously makes more of a difference when some parties have fewer candidates- I think it can underplay the strength of that party. The type of result where it makes a difference is say in a 2 member ward: Lab 1000, 980. Con 800, 750, LD 600, Green 500 where there has been an unofficial agreement between the Greens and LDs Top vote. Lab 34%, Con 28%, LD 21%, Green 17% Total vote. Lab 43%, Con 33%, LD 13%, Green 11% I think the former more closely reflects how close/ far away the LD and Green were from being elected. |
|
|
|
Post by LDCaerdydd on May 26, 2022 12:11:24 GMT
I was thinking in terms of total votes across a city/county. Ignore percentages for a moment, surely a vote figure should exist to say Labour won 120,000 votes in town X etc.
Most Wikipedia pages have a summary box. I’m looking at Cardiff in 2022, Labour are listed as having won 49,155 votes using the top method - when they won more given every seat in Cardiff is multi member.
|
|
|
|
Post by John Chanin on May 26, 2022 12:28:07 GMT
I always use the average vote, as it better reflects the overall position, and partially adjusts for personal votes, which can be very substantial in some cases. The main argument against is that it overestimates the percentage for parties that do not put up a full slate. While this is true, parties that don’t put up a full slate are rarely competitive, by definition.
The reason why top vote is usually used, including here, is that it is much quicker and easier to calculate, not because it is better.
|
|
|
|
Post by LDCaerdydd on May 26, 2022 13:08:08 GMT
The reason why top vote is usually used, including here, is that it is much quicker and easier to calculate, not because it is better. Gotcha, far from ideal though is it? I know in our weekly by-election tables here we include the change from the top and average. The top vote also doesn’t help in places like Powys and Pembrokeshire were two or three independent candidates stand in the same ward. I only ask as I’ve started adding up totals for various Wikipedia articles, but have now stopped. |
|
|
|
Post by jamesdoyle on May 26, 2022 13:27:46 GMT
Going back some years, on this forum or the predecessor, I was definitely an advocate for top vote. Davıd Boothroyd was an advocate for average vote. We debated it, and he was right, and I was wrong. I can't remember the evidence he put forward, in no small part because it was so convincing I didn't need to think about it any more. On the adding up all the votes - 'Labour got 120,000 votes here' - I'd find that a bit disingenuous, as it implies that many people voted for them - and of course, they didn't, it was 60,000 or 40,000 or whatever. |
|
|
|
Post by johnloony on May 26, 2022 15:05:15 GMT
When calculating local election vote totals for multi member wards which is better: - only including the top vote - including all votes Personally I would say the later, if there’s a two member ward every voter has up to two votes, so why would we not include all of them? I’ve noticed on Wikipedia totals are mainly but not exclusively calculated using the top vote method. I use the top vote. It obviously makes more of a difference when some parties have fewer candidates- I think it can underplay the strength of that party. The type of result where it makes a difference is say in a 2 member ward: Lab 1000, 980. Con 800, 750, LD 600, Green 500 where there has been an unofficial agreement between the Greens and LDs Top vote. Lab 34%, Con 28%, LD 21%, Green 17% Total vote. Lab 43%, Con 33%, LD 13%, Green 11% I think the former more closely reflects how close/ far away the LD and Green were from being elected. In your example, the top vote method makes: Lab 34.8% Con 27.6% LD 20.7% Green 17.2% and the average method (my preferred method) makes: Lab 34.6% Con 27.1% LD 20.9% Green 17.4% You only get the figures in your second line if you double-count the Lab and Con by adding up their votes without taking the average. In real life, I prefer to calculate the percentages by taking the denominator as the total number of ballot papers. In your example, the average votes add up to 2,865 and the top votes add up to 2,900, but the total votes add up to 4,630. If there has been an electoral pact between LD and Green, the number of ballot papers is likely to be c.2,600 - in which case I would calculate the percentages to be 990/2,600 = 38.1% etc. |
|
|
|
Post by minionofmidas on May 26, 2022 16:02:24 GMT
Lowest vote getter divided by the number of voters to cast at least one valid vote honestly sounds like it should be fairest, with a "split tickets" remainder.  Failing that: All added up, with an asterisk for undernominating parties. That would certainly enhance int'l comparability. I was under the impression that the very silly and misleading "top vote getter only" "method" continues to exist largely to enable comparisons in time, because full details for older elections can be hard to come by. |
|


 Failing that: All added up, with an asterisk for undernominating parties. That would certainly enhance int'l comparability.