|
|
Post by Pete Whitehead on Aug 21, 2015 20:06:05 GMT
As I say I'd like to do the whole country and it should be possible to do in the course of a five year parliament. Rural Wales does present particular difficulties because of the inconsistent nature of partisan competition in local elections. Much of Scotland was likewise in the past but this is less the case since STV. Now however the problem is that so many wards cross constituency boundaries and are often so large as to make the exercise fairly pointless. Against that it is possible to do much more detailed results now as polling district information is available. I did this for Fife just ahead of the Glenrothes by-election and was able to aggregare PD results to the old pre-2007 wards. this was however very time consuming. I may just as well leave Scotland to others who are more expert (like Andrew).
I haven't seen any of Baxter's calculations for 2015 and have never had much time for his methodology which ends up with parties getting zero votes in some wards and 100% in others. I recall that for example the Taunton Deane seat became more marginal for the LDs as a result of the removal of the West Somerset wards on the basis that the Tories won no votes there (as all the wards were won by Independents in the local elections).
|
|
|
|
Post by Pete Whitehead on Aug 21, 2015 20:10:16 GMT
I agree with Matt84 - amazing work Pete.I have a question - how did you work out ward electorates/turnout in London, I ask as Martin Baxter of Electoral Calculus based his estimates on the number of postcodes in each ward (which has produced some very strange numbers!) - thanks  2014 (local) electorates and 2010 turnouts. Not ideal for a number of reasons but the best I had to go on |
|
|
|
Post by afleitch on Aug 22, 2015 14:31:49 GMT
Baxters calculations aren't bad. I've done ones for Scotland. I'm currently doing them if I can back to 1983... Baxter's ward calculations for Scotland are pretty much random trash (no offence, I mean his website has it's own limited charm). Have you started your ward estimates for Scotland 2015 yet?  I'm waiting for some more BES stuff before I start 2015. I've played about with it, but it's really an election better served by looking at everything but local election results  Before then, I've used local elections for 'partisan' areas and demographic data for rural areas. They actually published ward level data for 2007 which I've used to tweak some of the results as it gives better voting patterns in rural areas. 2015 is going to be a tough one! |
|
|
|
Post by Pete Whitehead on Aug 22, 2015 14:40:21 GMT
iain I've redone the figures for Cheltemham by throwing the 2012 locals into the mix and I'm much happier with the results. Updated the maps on page 6 I'll send you the before and after figures. Always glad to have some constructive feedback. I will now use the same method with Gosport and Fareham and any of these other tedious places which didn't have local elections in May 2015
|
|
|
|
Post by Pete Whitehead on Aug 22, 2015 15:31:05 GMT
I do think its useful to use the pre-2007 wards and am I not right in thinking these are the building blocks on which the current parliamentary constituencies area based? As I say its possible to do this by aggregating results from the relevant PDs which information is available from SP elections which has the advantage also of giving a consistency of partisan participation. The one big drawback for me is the sheer time it would take but for someone dedicated soley to that taskit would be doable
|
|
|
|
Post by afleitch on Aug 22, 2015 18:28:42 GMT
I do think its useful to use the pre-2007 wards and am I not right in thinking these are the building blocks on which the current parliamentary constituencies area based? As I say its possible to do this by aggregating results from the relevant PDs which information is available from SP elections which has the advantage also of giving a consistency of partisan participation. The one big drawback for me is the sheer time it would take but for someone dedicated soley to that taskit would be doable I would be willing to do so although I'm not entirely confident on how to ensure a degree of accuracy in the results given the rather unpredictable effect that the 2014 referendum has had on voting in Scotland. Where would I be able to find a breakdown of results by polling district (presumably for the 2007 SP election?) The 2007 results might be offline now. I have them saved and transferred them to ward level to 'save' them as polling districts were falling out of date. Polling district results for the 2012 locals are published at a council level but you have to match boxes to districts and it takes time. The problem as you say, is that voting patterns have inverted. If you use the old method for Edinburgh South, you end up with Labour leading in Liberton, Gilmerton etc where the opposite was probably true. I've tested results using religious identity and it looks like a good fit (and patterns of religious based voting in the referendum screams out from the date). For example BES data shows the SNP vote amongst Catholics leapt from 18% to 55% and they are now their strongest vote base (the Labour vote amongst Catholics in 1997 by comparison was 80%) |
|
|
|
Post by Pete Whitehead on Aug 22, 2015 19:15:19 GMT
Did they not do PD breakdown for the 2011 elections? I obviously had the 2007 ones if it was pre-Glenrothes and assume I probably still have all the data saved somewhere.
|
|
|
|
Post by Davıd Boothroyd on Aug 22, 2015 19:18:37 GMT
I don't think the 2011 Scottish Parliament elections were electronically counted. The PD breakdown is an output from the electronic counting software.
|
|
|
|
Post by afleitch on Aug 22, 2015 20:54:43 GMT
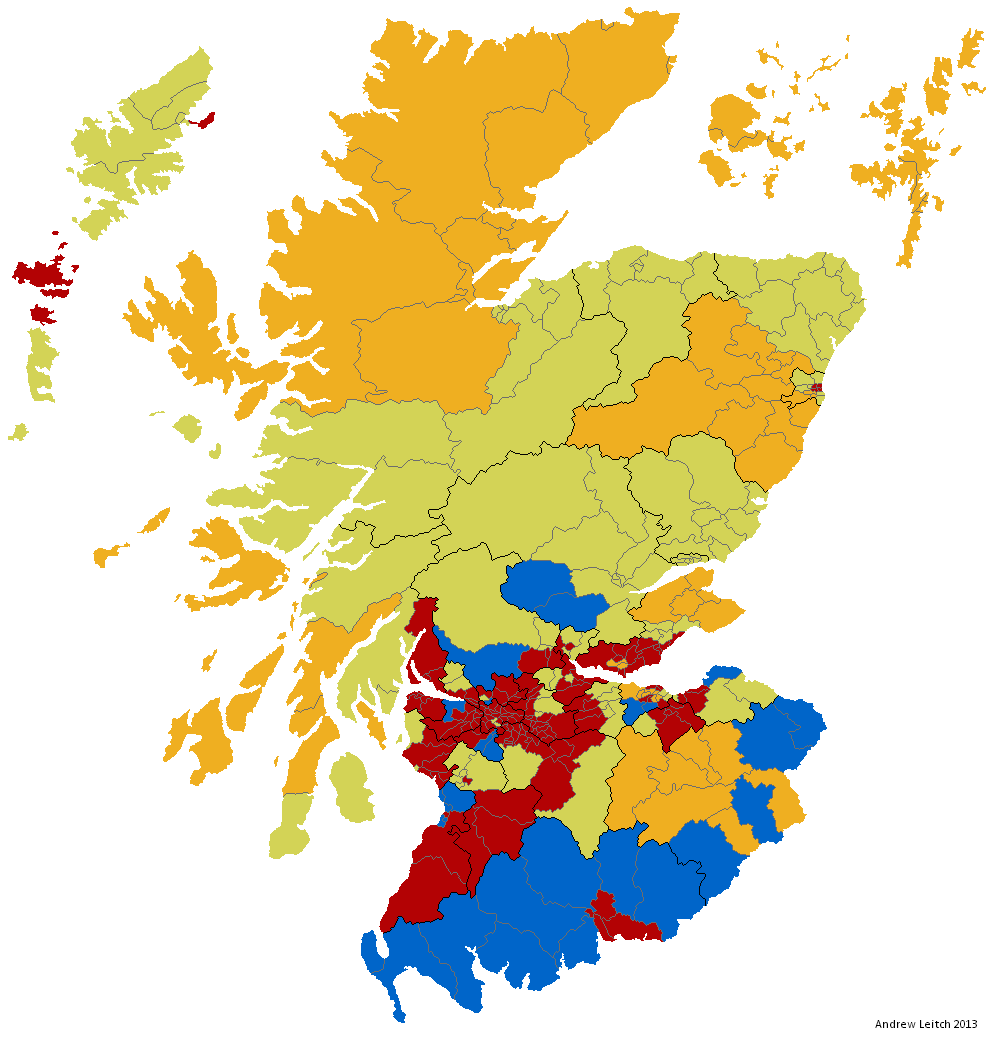
For reference again here is the actual map for 2007. As I noted at the time, postal votes weren't counted by ward or polling division so they were apportioned out. What makes this a snapshot of it's time is the very solid and uniform Lib Dem vote where they won in rural areas. The Highlands is quite monolithic; the SNP support in Inverness East, Nairn and Lochaber is likewise as uniform. The SNP vote in the central belt at this time is very rural/middle class; look at the North Ayrshire coast, rural Lanarkshire and even East Lothian. These are areas that during the 80's at the Regional level tended to return Tories. The SNP even managed to squeeze a first place in Bearsden North (with the Tories ahead in Bearsden South despite being way out of contention in the seat) It's important to note that in the 2012 locals, where voting intentions where more equal the same patterns were found. While SNP support in these areas was higher in 2011 and in most cases in 2015 too than in 2007, their support has increased more in areas where Labour used to be comfortably ahead. However, it's likely that Labour were still stronger in say Barrhead than they were in say Newton Mearns because in many affluent areas you still had a sizeable Tory presence. Labour were only ahead of the Tories by 9% nationwide.  |
|
|
|
Post by afleitch on Aug 22, 2015 22:16:46 GMT
I agree with you. I posted it to show different 2007 is to now.
|
|
|
|
Post by No Offence Alan on Aug 23, 2015 5:50:39 GMT
I genuinely miss FPTP in local Scottish elections due to the higher turnout it evoked ... I think that was more to do with 1999 and 2003 local elections being the same day as the Scottish Parliamentary elections, rather than the voting system. I think reproducing the 2015 results at ward level might be easier than doing so for the 2010 results. In 2015 isn't it a case of "find the wards that aren't SNP"? |
|
The Bishop
Labour
Down With Factionalism!
Posts: 38,889
|
Post by The Bishop on Aug 23, 2015 8:50:52 GMT
Well yes, that was my thought too.....
|
|
iain
Lib Dem
Posts: 11,427 
|
Post by iain on Aug 29, 2015 11:57:54 GMT
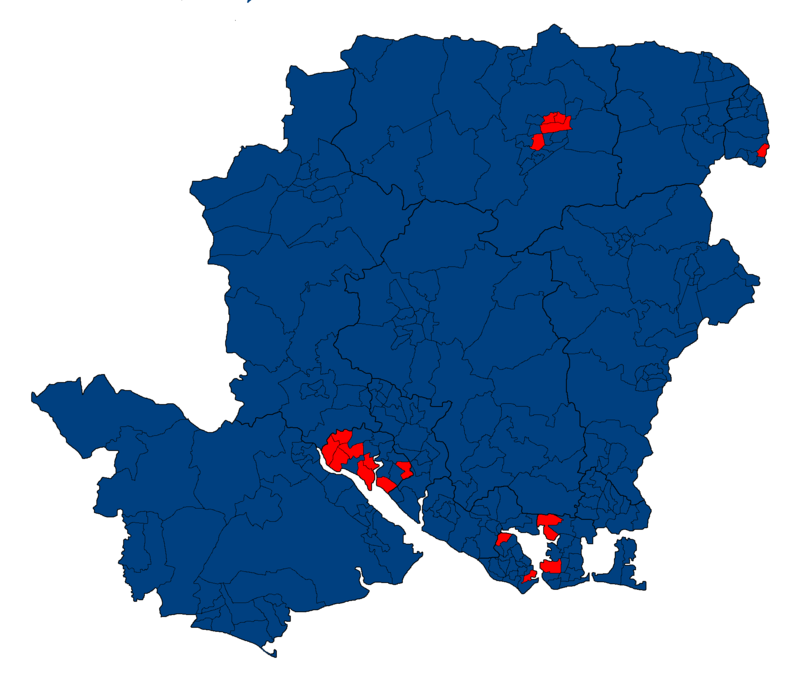
Which county are you doing now Pete?
|
|
|
|
Post by Pete Whitehead on Aug 29, 2015 20:31:05 GMT
Which county are you doing now Pete?  |
|
|
|
Post by Davıd Boothroyd on Aug 29, 2015 20:31:50 GMT
The Lib Dems won nothing at all?
|
|
|
|
Post by Pete Whitehead on Aug 29, 2015 20:32:57 GMT
|
|
|
|
Post by Pete Whitehead on Aug 29, 2015 20:38:53 GMT
The Lib Dems won nothing at all? Yeah - their problem is that in the two seats where they are strongest they're strong in every ward so don't have the concentration of support. IN Eastleigh for example they didn't get above 30% or below 20% in any ward. The closest they came to winning was in Fratton (but were third there) followed by one of the Winchester wards (there being much greater disparity in Winchester between their strong and weak areas) |
|
|
|
Post by akmd on Aug 29, 2015 21:00:29 GMT
Thank you for doing these maps, Pete. Could you do East Sussex at some point please? It would be interesting to see how the Brighton & Hove wards voted in the GE.
|
|
Khunanup
Lib Dem
Portsmouth Liberal Democrats
Posts: 12,005
|
Post by Khunanup on Aug 30, 2015 15:57:50 GMT
The Lib Dems won nothing at all? Yeah - their problem is that in the two seats where they are strongest they're strong in every ward so don't have the concentration of support. IN Eastleigh for example they didn't get above 30% or below 20% in any ward. The closest they came to winning was in Fratton (but were third there) followed by one of the Winchester wards (there being much greater disparity in Winchester between their strong and weak areas) Well it didn't actually quite happen that way of course, not in Portsmouth (I'm intrigued by your calculations Pete, especially in the wards we won in the locals in South) where our GE vote was considerably worse in some wards vis a vis the local election vote and in others it was very similar, often as a result of churn. If you PM me the figures I'll give you some thoughts on them. |
|
|
|
Post by A Brown on Sept 3, 2015 12:17:59 GMT
I think Labour would have won Fa'side in East Lothian, Johnstone S in Renfrewshire and NW Dumfries TBH
|
|