|
|
Post by afleitch on Mar 22, 2018 20:30:02 GMT
The changing base units of local politics is a bit of an annoyance to me. So I'm doing something for fun. I'm going to project how each ward would have voted had it existed in each General Election.
By no means is this ever going to be accurate. It can't be. But it allows for some uniformity in pattern of support. Also current wards are more 'community' based than past wards, which I think allows for a stronger visual comparison.
What forms these results?
1. Actual local election results from 1974 to date.
2. 2007 actual ward data (which is used to supplement votes in non partisan rural areas. Quick note; party support there is fairly uniform )
3. A sprinkle of demographic regression.
4. The Boundary Commission map data and Census data to allow me to divide each ward into smaller parts, or split them between past constituencies.
Please note I'll be taking my time with these. 1992 is my test.
For example, by using current wards rather than those that existed in 1992 (Electoral Divisions) you get better results in Strathclyde (where current wards are smaller) and less drastic results in say the Highlands (where current wards are larger)
My intention is to go back to 1970 (using 1971 census data for population). Before then you are dealing with massive differences in voting behaviour and demographics.
Bear with me!
Again it's just fun.
|
|
|
|
Post by afleitch on Jun 18, 2020 19:13:29 GMT
Only took two years and a lock down. I posted these on another place first so here you are The UK and Scotland do not produce lower tier results for General Elections; i.e anything below the constituency level. Also the building blocks of seats; local authorities and their wards can very and change over time. I have always wanted to show how parts of the country could have voted at each election. And keep those areas consistent even as the seats themselves change. So I have decided to use current Wards (in place since 2017 and revised from the new system in place since 2007) to show this. So how did I do it? 1. I used the generally partisan results for the local government Regional Elections in 1982, 1986, 1990 and 1994 to create a 'matrix' of results that I could then collapse into the current wards. Later local elections were used to do the same for later results (some of which I still need to finalise) 2. In 2007 ward results were in fact published for the Scottish Election. I compared these to the local elections that took place on the same day to see where there were any differences caused by hyper local partisanship in council elections or the votes of 'personality' candidates (Salmond, Goldie, Sturgeon etc) or constituency votes themselves. The short answer is that there is less variance within seats as you find within the constituent parts of the seats, usually wards. This has been noted before, notably in work undertaken by Dorling et al looking at 1992 notional results. Party support was in fact more uniform across those larger areas except where there were significant socio-economic differences in seats. At least back when that mattered more. 3. I was able to use the 2007 results and some regression analysis for seats in the Highlands, Islands, Borders and Dumfries and Galloway which had historic non partisan elections (an a tradition of unopposed candidates). 4. In the case of 1974 and 1979 results will be broadly matched to the findings of the notional results produced from BBC/ITN. While I could have done the same for 1992, it suited the model given the differences I mentioned earlier to use my own findings. So here is 1992 which I used as my trial. Why? Well there are 'notional' results already (in time for the new seats fought in 1997) to compare to, it's a good last (well second last) 'hurrah' for the Tories and the established voting patterns from 1979-1992 and finally it's good for comparing the huge shifts in voting that continued to 2007. 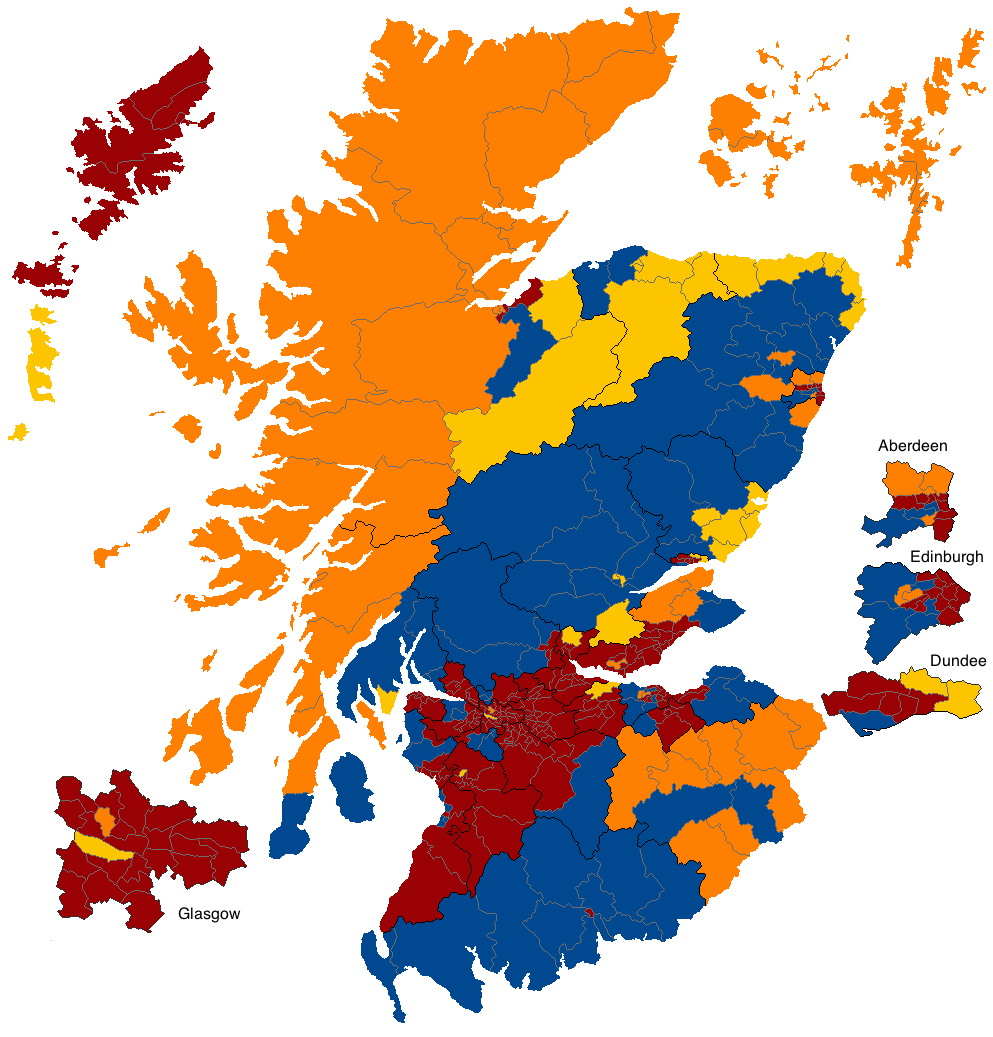 It might be helpful to have at hand the 1992 constituency map but here are a few key points. Labour dominance is easily seen here, but so too is each parties dominance in seats they hold. There are some little local differences and patches of concentrated support for second (and in some cases third) placed parties. Inverness, Nairn and Lochaber was effectively a four way tie with every party winning a ward. The Liberal Democrats narrow win in Gordon can be seen, as can their narrow loss in Kincardine; there's pockets of support in wards in and around Aberdeen. Likewise the SNP's strong second place in some seats nets them ward 'wins' in Dundee East, Linlithgow, Glasgow Govan and Perth and Kinross. You can see the same with the Lib Dems in Edinburgh West and in Glasgow Hillhead. Despite only winning Eastwood and Ayr within the old Strathclyde Region, the Tories can be seen ahead in parts of Cunninghame North, West Renfrewshire and in towns like Bearsden and Milngavie. 1987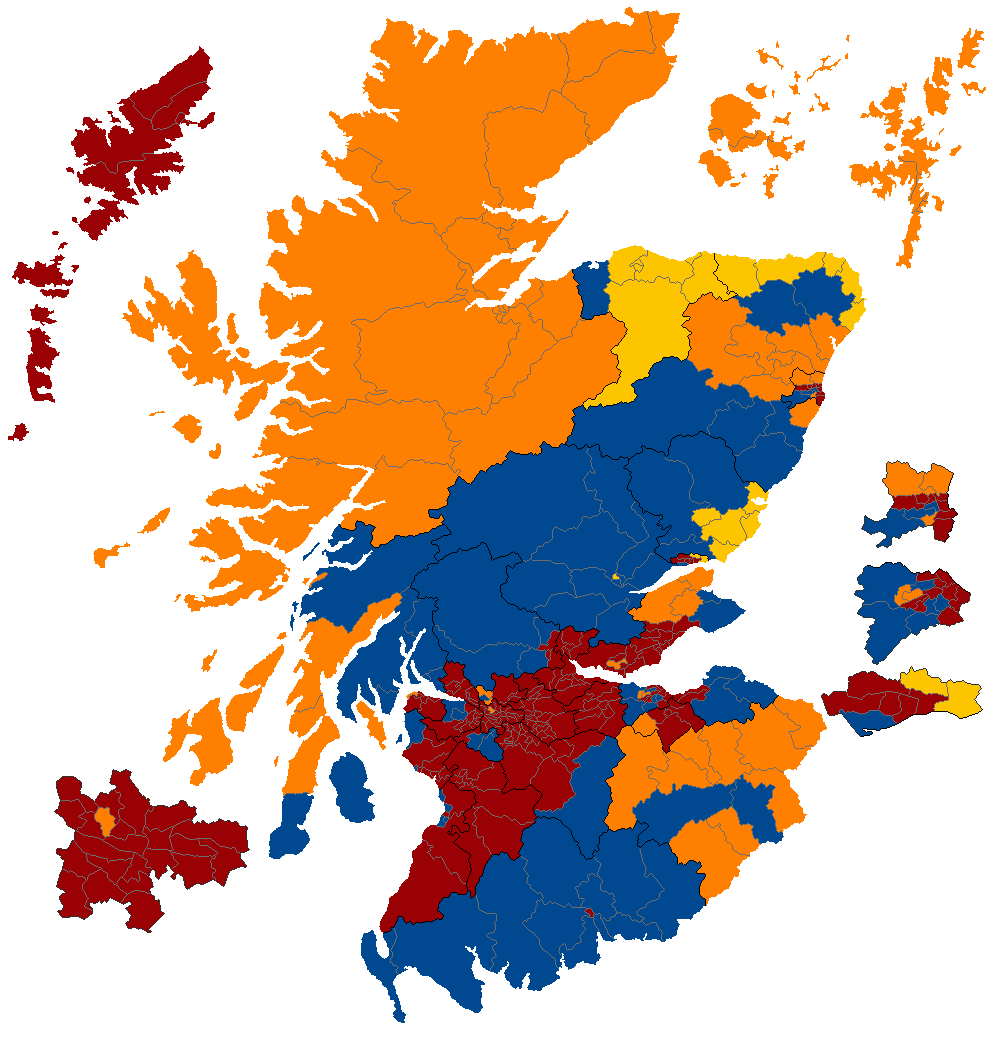 1983 1983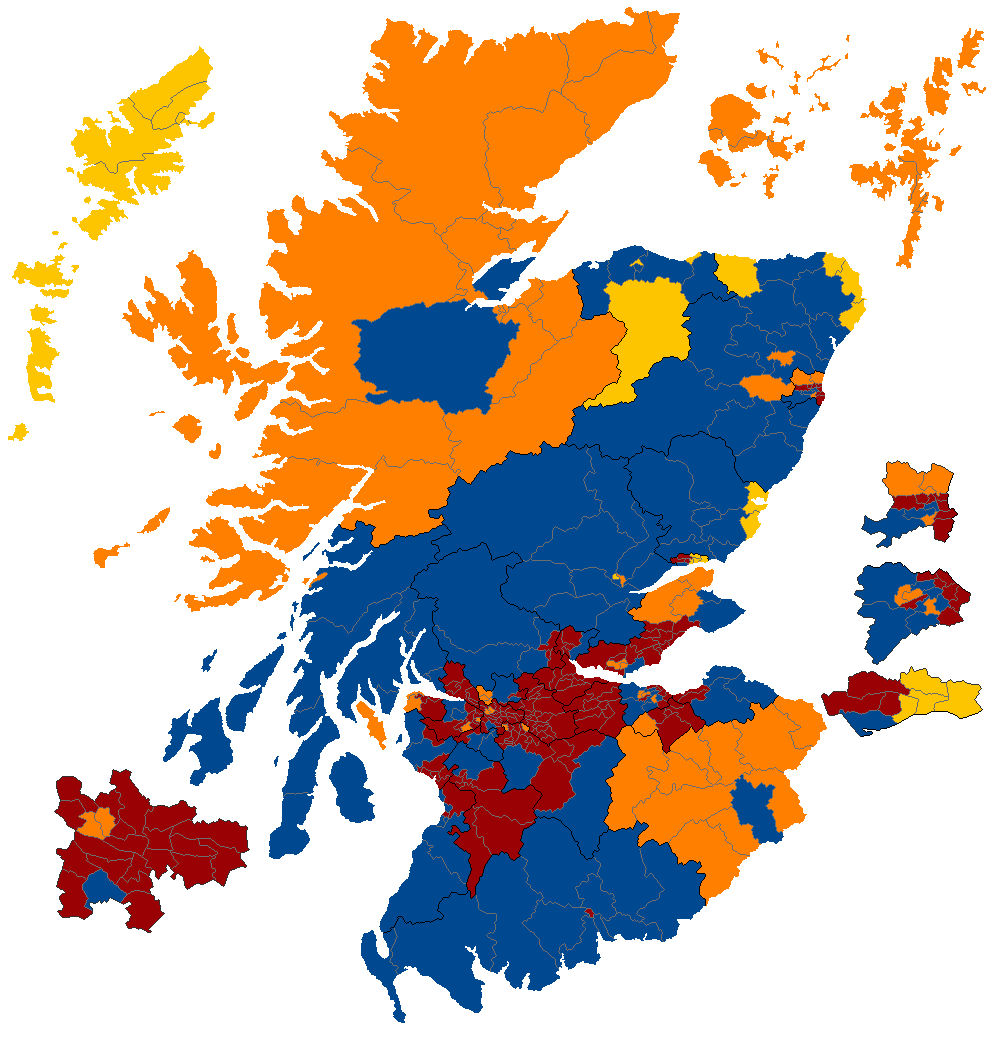 Note the Labour ward in Orkney in 1987! (by 1 vote) Again, the Islands are broadly weighted by 2007 and regression so take with a mine of salt.1987 is very uniform but in 1983 you can see how uniform Labour's vote actually was despite the Tories and the Alliance taking a swathe of wards. North Lanarkshire, West Lothian and Falkirk are solid Labour. Look at East Dunbartonshire, where the Alliance take the Bearsden/Milngavie wards with the Tories taking more rural wards but then Labour ousting the Tories from those wards but the Tories gradually ousting the Alliance. Note the uniformity in Aberdeen; no wards switching. In 1983 you can see the last Tory outpost in Glasgow in Newlands/Auldburn. |
|
|
|
Post by MacShimidh on Jun 18, 2020 21:02:21 GMT
Fascinating work, thanks for this!
|
|
|
|
Post by afleitch on Jun 18, 2020 21:29:11 GMT
Fascinating work, thanks for this! Thank you. I'm working on October 1974 and 1979, then 1997 onwards. |
|
Deleted
Deleted Member
Posts: 0
|
Post by Deleted on Jun 19, 2020 2:18:28 GMT
I choose to accept these as gospel, if only because I love the idea of a ward in Orkney voting Labour. This is fascinating stuff!
|
|
|
|
Post by afleitch on Jun 19, 2020 11:27:27 GMT
I choose to accept these as gospel, if only because I love the idea of a ward in Orkney voting Labour. This is fascinating stuff! You know I was going to revise Orkney and Shetland...but we'll see  |
|
|
|
Post by afleitch on Jun 19, 2020 15:08:55 GMT
EDIT: So yes, my model concentrated the Alliance/Lib Dem vote too strongly in Shetland. After amending this, it's enough to send enough votes to the Alliance/Lib Dems so that they win each ward in 1983 and 1987. I'll fix the maps later.
|
|
|
|
Post by afleitch on Jul 4, 2020 14:46:35 GMT
I have amended the maps already done to take into account the adjustments to Orkney and Shetland and after a copy mistake on my part, the Alliance/Lib Dem's now show some presence in Dunfermline. Now for 1974
Now this is based heavily on working backwards from the figures provided in the BBC/ITN Guide for the 1979 results. Indeed while I've finished 1979, I still have to model the strong result for Jim Sillar's Scottish Labour Party result in Ayrshire South which could actually net him one or more wards. So I've went with 1974 first 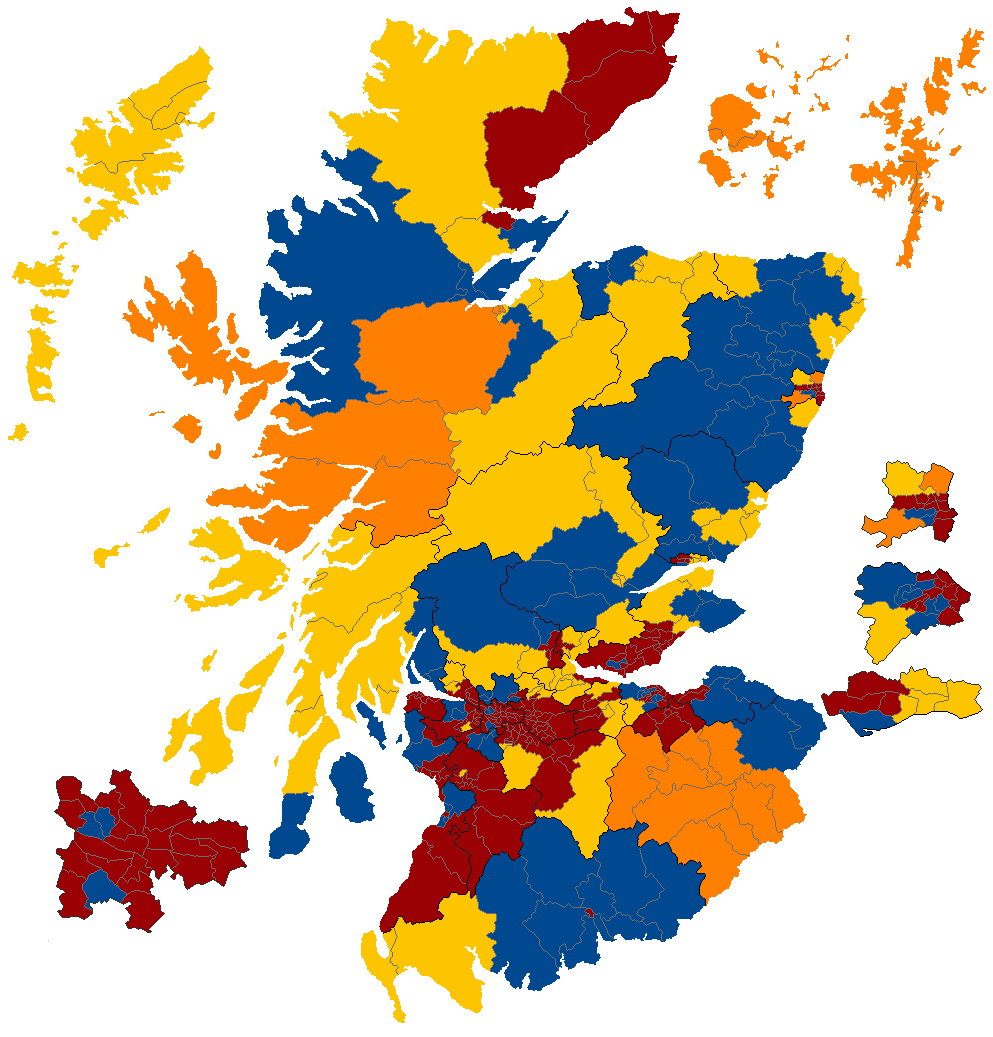 If anything the SNP were shafted by the geography of the old seats (which were based on the old county system). Had the 1983 seats been in place they would have won Stirling, Falkirk West, Livingston and Cumbernauld and Kilsyth amongst others. Indeed you can see an 'arc' of SNP support starting in Vale of Leven, through the Forth Valley, Falkirk, Livingston and right down towards Edinburgh. They of course only won Clackmannan and East Stirlingshire and Dumbartonshire East. Dumbartonshire East was split between the towns of Bearsden where the Tories are ahead, Kirkintilloch where Labour are strongest and Cumbernauld where the SNP are strongest. There are also a few 'quirks'. Despite Labour winning in Dumbarton (Dumbartonshire West) they win only one ward, close second SNP win two and the Tories in distant third win three However Greater Glasgow is pretty barren for the SNP. Much of that is in line with where there was an still is, a sizable Catholic vote. The same is true in Fife. The SNP are almost locked out of Edinburgh and Aberdeen twoo. In what would later become SNP 'heartlands'; Moray, Banff, Angus SNP support is not quite geographically dominant and their support is found in the same wards they would be first or challenging in right through the 80's and early 90's. The Highlands is a mess. Labour still held Caithness with the Tories wining Ross-shire and the Liberals held Inverness-shire (as would be the case in all three in 1979) However the SNP were breathing down their necks in all three so pick up a number of wards. You can also see the SNP a close second in East Fife, Dumbarton, East Kilbride etc. |
|
|
|
Post by afleitch on Jul 4, 2020 19:32:49 GMT
And now 1979
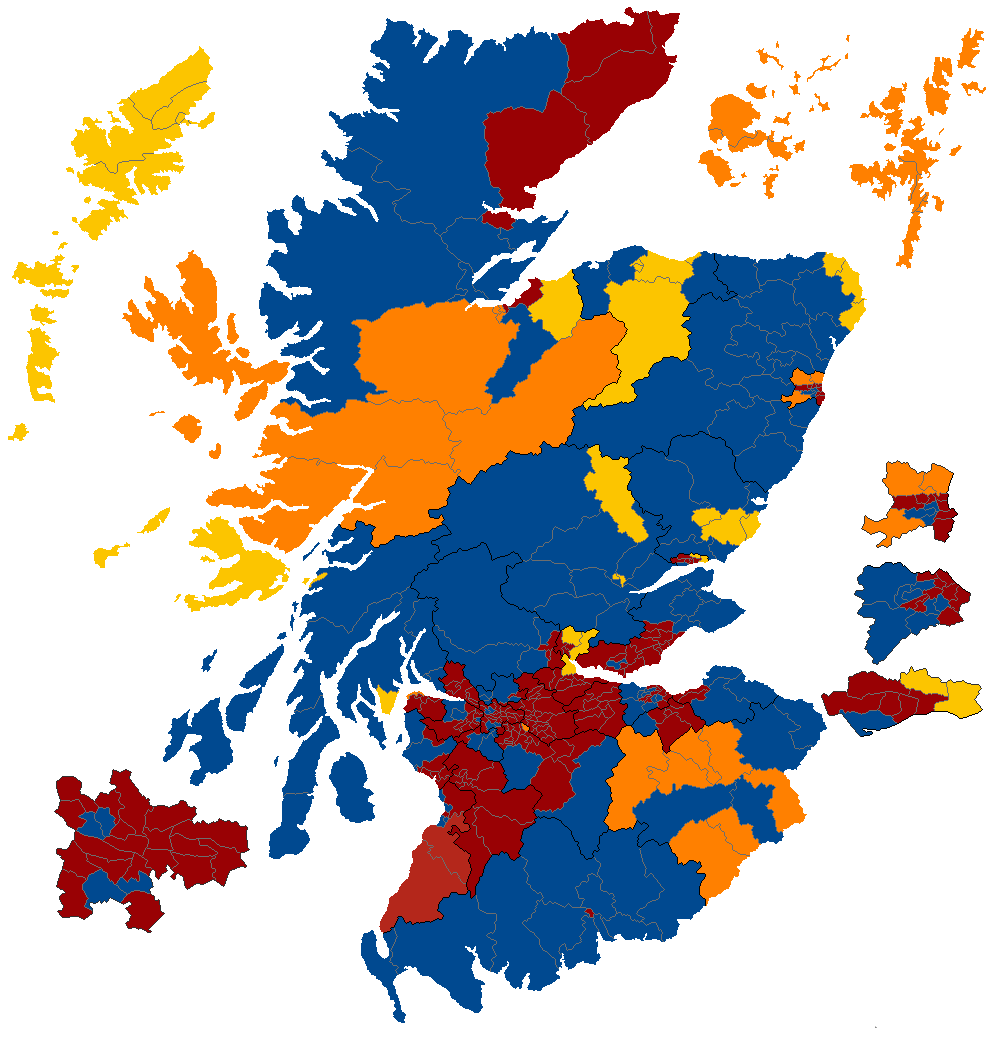 Compare to 1974 and 1983. Now again these are based on the BBC/ITN Guide so there's a few interesting wards that look out of place; Aird and Loch Ness (Liberal in 1974 and 1979 but Tory in 1983) which was split down the middle with the new boundaries. Lower Deeside in Aberdeen which is Liberal but then Conservative in 1983 as it shifted out of Aberdeenshire West and into Kincardine and Deeside. However the broader picture is consistent. The SNP have collapsed, but not completely. They were a close second in seats they lost to the Conservatives in Clackmannan against Labour. There are a few holdouts in Argyll and Bute for example. Note the Conservative redoubt in Glasgow; in Newlands/Auldburn and Langside which would fall to Labour and in Victoria Park and Partick East/Kelvindale they would lose to the Alliance who would later lose them to Labour. The Liberals win two wards in Greenock and curiously, Bothwell. Jim Sillars tops the poll in two wards; the only time a party or candidate other than the big four win anything. |
|
|
|
Post by afleitch on Jul 9, 2020 18:08:11 GMT
And now 1997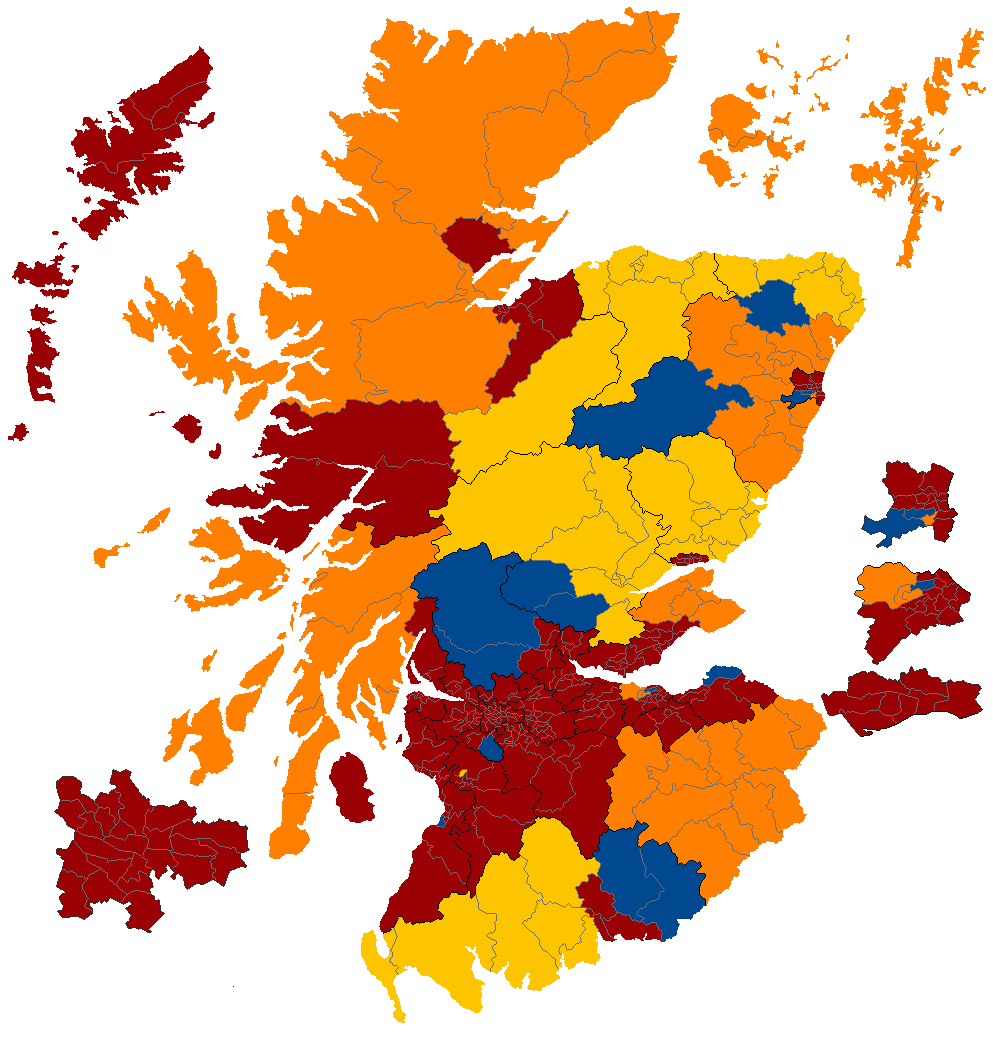 So here it is. Not a complete Tory wipeout after all. Remember this election was still the best Tory performance in terms of vote share until 2016(Holyrood) or 2017(Westminster) You can see two things happen; Labour sweeps other parties out of most of the wards in the seats they hold and secondly, the challenger party to the Tories sweeps wards almost uniformly. It's worth noting that Labour topped the poll in the Highlands and pushed the Lib Dems very close in both Caithness and in Ross. There are a few Tory hold outs in Annandale and in both Stirling and Perth. Aberdeen is an interesting one, the Tories holding up a bit better in the parts of the new Aberdeen South they would have held before. In many seats the Tories faced a steeper collapse in 2001. |
|
Deleted
Deleted Member
Posts: 0
|
Post by Deleted on Jul 9, 2020 19:25:56 GMT
Would Colinton & Fairmilehead really have gone Labour in 1997?
|
|
|
|
Post by MacShimidh on Jul 9, 2020 19:28:09 GMT
I've been waiting for this one. Labour's share of the vote wasn't quite as high as in the 50s and 60s, but some of their gains truly were extraordinary. In hindsight it's amazing to me that they did so well in the Highlands. The fact they held a variant of the Dumfries seat right up until 2015 seems even weirder today though.
As you say, 2001 was a worse election for the Tories in many ways, even though they managed to claw back a seat. And 2015 was even worse for them than that!
|
|
|
|
Post by afleitch on Jul 9, 2020 21:09:42 GMT
Would Colinton & Fairmilehead really have gone Labour in 1997? I have Labour leading by 1.2% in that ward. The Tories really slipped back; they ended up 5k votes behind in the seat and the unusual ward design in that part of Edinburgh (those weird finger like wards) don't help them. I have the Tories back ahead in that ward in 1999 (and presumably in 2001 when Rifkind made a spirited attempt to win it back) Some of the hardest swings from the Tories in 1997 were in Strathkelvin and Bearsden, Eastwood, Pentlands etc. I've been waiting for this one. Labour's share of the vote wasn't quite as high as in the 50s and 60s, but some of their gains truly were extraordinary. In hindsight it's amazing to me that they did so well in the Highlands. The fact they held a variant of the Dumfries seat right up until 2015 seems even weirder today though. As you say, 2001 was a worse election for the Tories in many ways, even though they managed to claw back a seat. And 2015 was even worse for them than that! Yes. Not just the Tories too. In 2001, Labour were second in Moray, just 5% behind the SNP winning both Elgin wards in the model and second in Argyll and Bute by the same amount behind the Lib Dems. In Argyll and Bute, Labour would have been ahead in my model in South Kintyre and Dunoon. |
|
|
|
Post by afleitch on Jul 13, 2020 20:13:09 GMT
I'm diverging, for now, and looking at Holyrood elections as the proxy election. I'll probably do Westminster elections again eventually 1999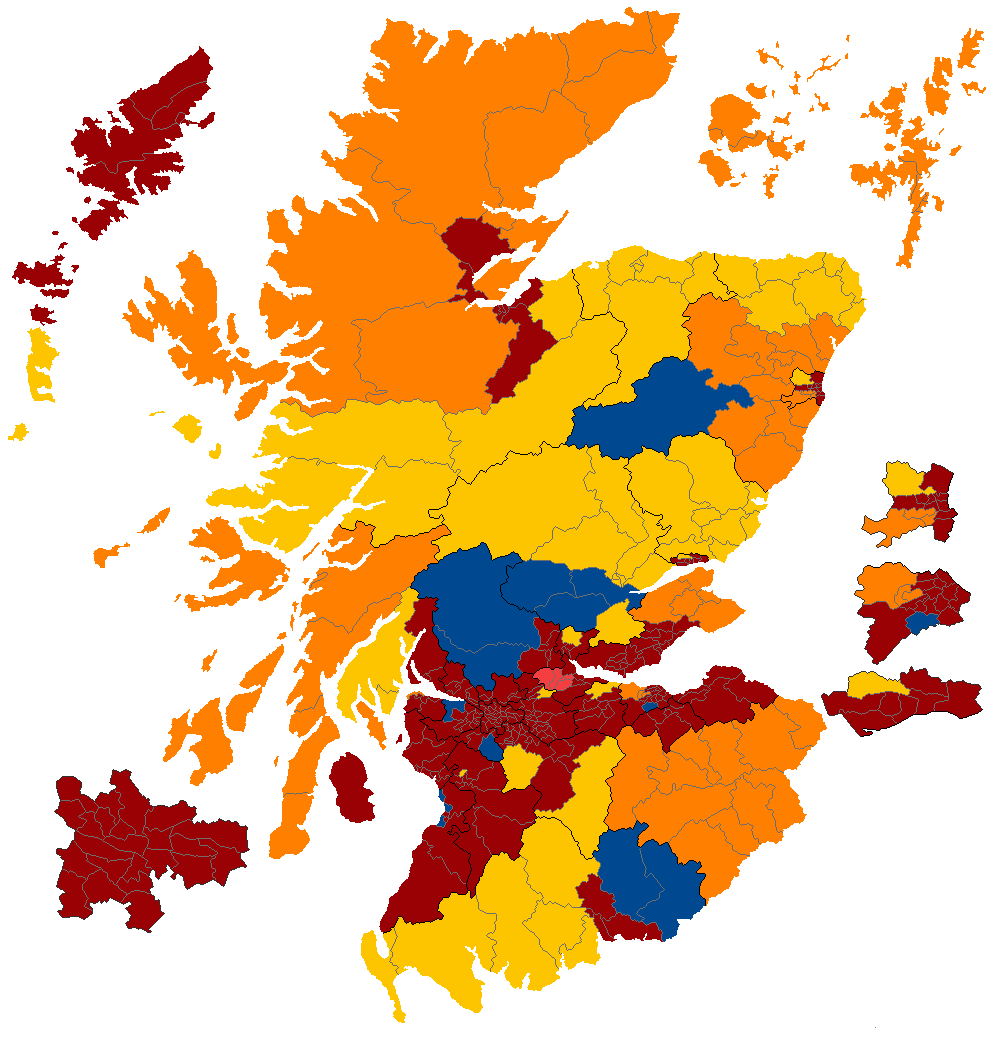 So here we are just two years later. While only two seats flipped; Inverness East, Nairn and Lochaber to the SNP and Aberdeen South to the Lib Dems, there are a few changes under the surface. The SNP are starting to make inroads into Avondale, Clydesdale, Cumbernauld, Linlithgow etc; pushing Labour back in those wards that as we've seen before, tended to be won by other parties. Glasgow and Edinburgh are still Labour strongholds. In the Highlands you can see the SNP pushing Labour out in rural Inverness East, Nairn and Lochaber but Labour flipping Dingwall from the the Lib Dems. Dundee is a strange one; the SNP actually were so close in Dundee West but further behind in Dundee East. Indeed in one ward; Lochee, Labour and the SNP are neck and neck. No votes apart. I've coloured it for Labour simply because they won the seat overall. The Tories make a few inroads, especially in Ayr but also fall back in a few areas. The Lib Dems are holding their own and challenging in Inverclyde. But there's nothing that unusual; apart from the Tory desolation continuing. No unusual results. SNP winning a bit in Argyll, picking up a ward in Aberdeen North. There's Falkirk; in pink. Dennis Canavan's 'unofficial Labour' win. But barring that, it seems quiet |
|
|
|
Post by afleitch on Jul 14, 2020 18:09:30 GMT
And now 2003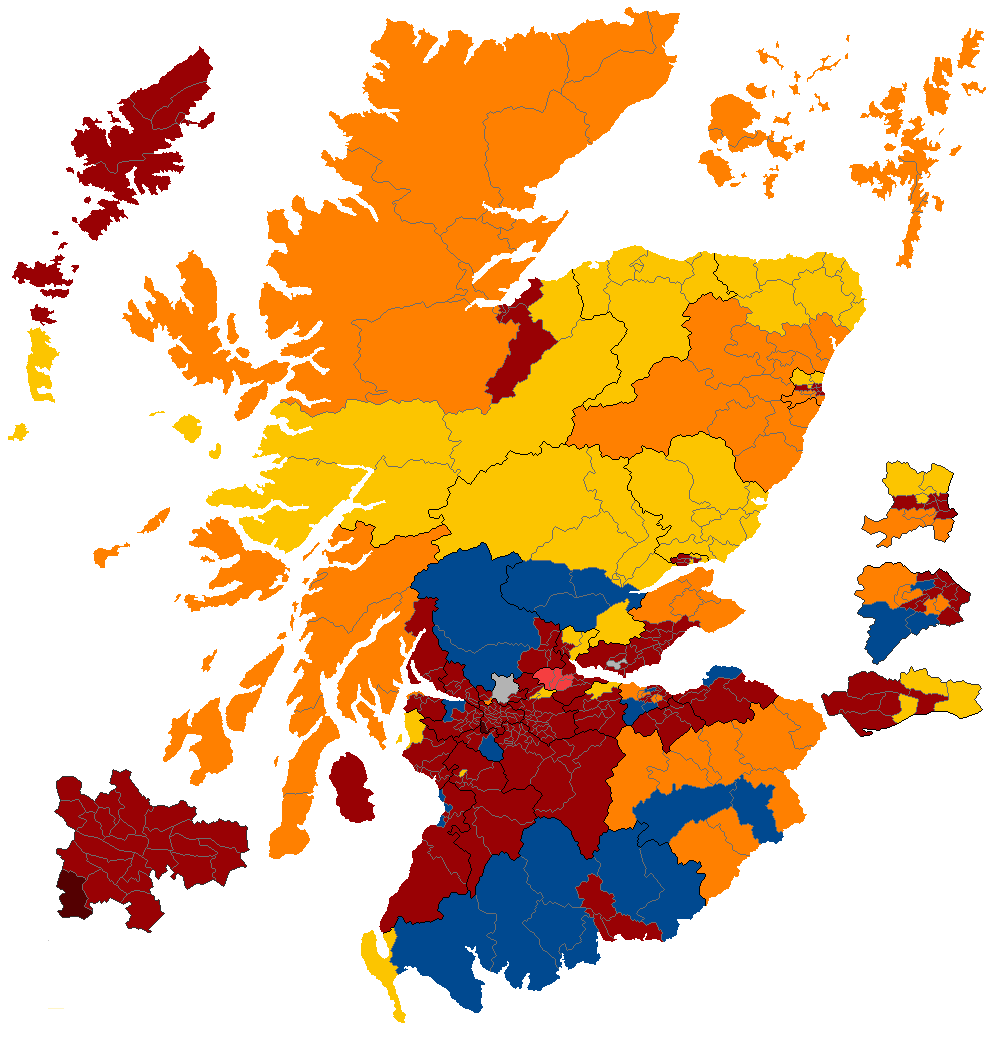 2003 was not a great year for Labour, but neither was it a good year for the SNP. While they finally picked up Ochil, Dundee East and Aberdeen North, they lost Galloway to the Tories who also picked up Ayr and Edinburgh Pentlands from Labour. The Lib Dems too also picked up Edinburgh South and an Independent knocked Labour out in Strathkelvin and Bearsden. You can see Labour's dominance in the cities, well excepting Glasgow taking a knock. The one lone ward in Glasgow that isn't Labour is Greater Pollok won by Tommy Sheridan of the SSP. Dr Jean Turner despite winning the whole seat only really picks up one ward. While she is ahead in the part of Lenzie and Kirkintilloch South ward that's in the seat, Labour overwhelm her in the part of the ward thats in Coatbridge. There is also another 'Hospital' presence in Dunfermline Central. This was a year of Save Hospitals as much as it was a year of the SSP, the Greens and Senior Citizens. The Tories make significant advances in the South of the country, pushing the SNP out in Galloway, and making their presence felt in Edinburgh and in Ayr. While the SNP are close in Cumbernauld, they lose a few wards to Labour in west central Scotland. |
|
Clark
Forum Regular
Posts: 744
|
Post by Clark on Jul 14, 2020 21:06:54 GMT
Great stuff. What would you say has been the most strongly Labour town / ward in Scotland over the years?
I was thinking maybe Cumnock, Cowdenbeath/Lochgelly, Springburn, Coatbridge, Kilsyth, Prestonpans...
|
|
|
|
Post by afleitch on Jul 19, 2020 19:28:03 GMT
And now 2007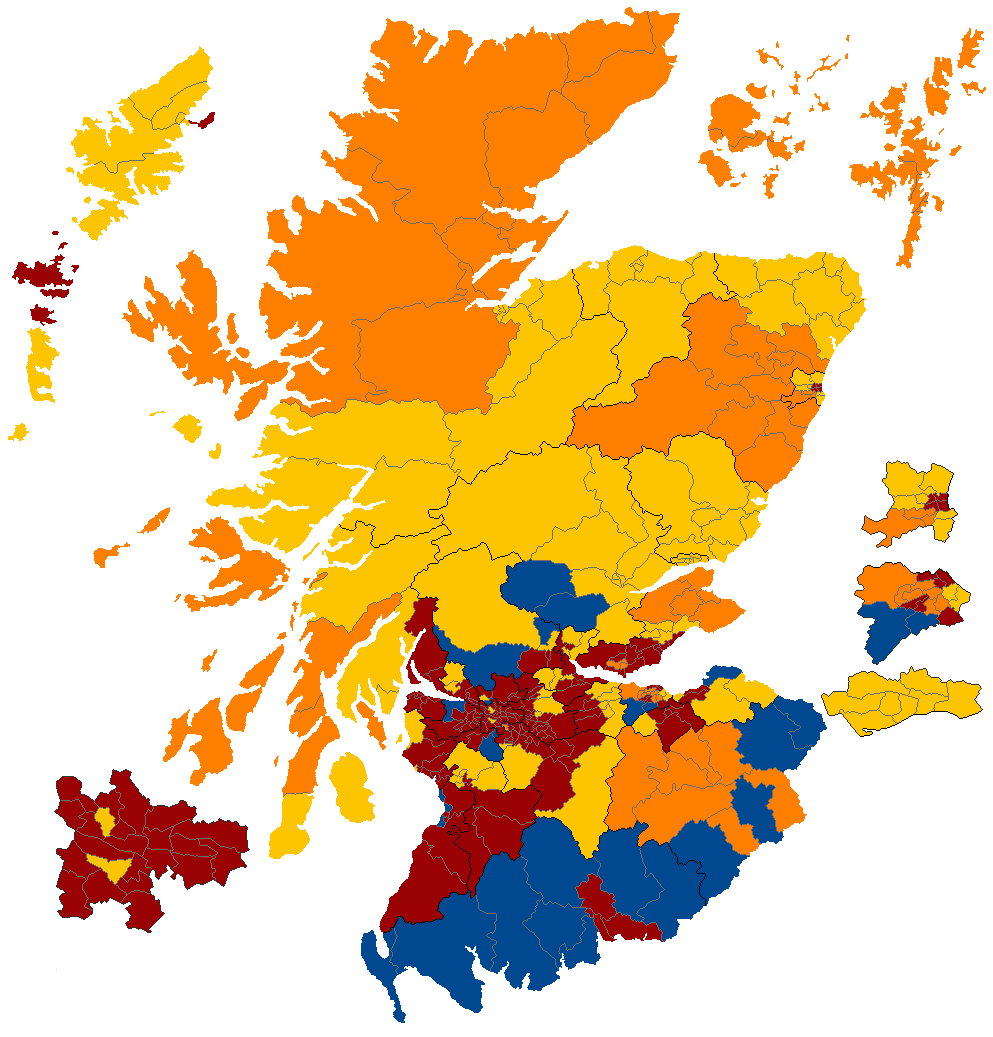 This is the actual result, rather than a guesstimate with the only amendments been to adjust the wards from 2007 to 2012. The SNP topped the constituency poll across Scotland, but didn't top the FPTP seats. You can start to see the 'red wall' breach though. Labour are ousted from Dundee, reduced to a rump in central Aberdeen. In Edinburgh they are reduced to just six wards at the expense of the Lib Dems and the SNP, making it's first foray into Edinburgh. In Glasgow, the SNP win in Pollockshields and in Partick East/Kelvindale. You can see the SNP advances, similar to 1974 in west central Scotland; Falkirk, Livingston, Dumbartonshire, Kilmarnock as well as East Lothian. The SNP gain Central Fife and Stirling; you can see a huge uniform move to them in Glenrothes. While Labour gain Strathkelvin and Bearsden, you have the oddity of the Tories winning in Bearsden South and the SNP in Bearsden North. Labour are ousted from the Highlands etc (barring a ward in the Western Isles) While this was not a good election for the Lib Dems (though worse was to come), they won in Dunfermline East where you can see them winning two wards in Dunfermline and they have a very unusual pick up in Rutherglen South. The Tories make advances near the border, but drop back a bit in Stirling and Perthshire. It's a good election for them to consolidate their vote in key seats. Despite this Labour still have a uniform vote where it matters to them, winning heavily working class areas with the other parties picking around the edges. |
|
|
|
Post by afleitch on Jul 19, 2020 21:50:41 GMT
For those wondering about Gordon; Salmond stormed it in the parts of the seat in Moray and in Turriff, which was in his old seat from 1987-1997. Likewise in Ellon. He also topped in Huntly, but that is in a ward that straddles West Aberdeenshire so the Lib Dems topped the poll overall.
|
|
|
|
Post by afleitch on Jul 30, 2020 18:53:15 GMT
And now 2011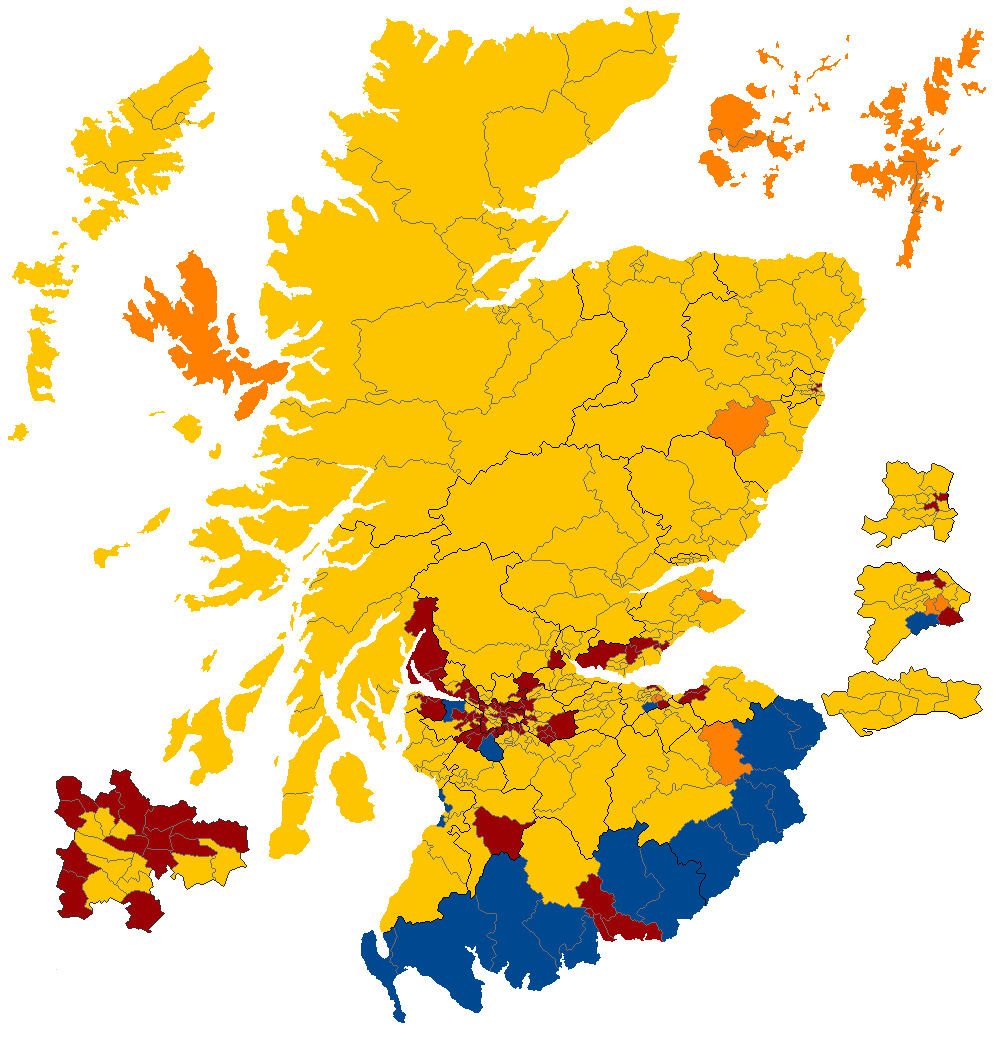 So... Labour collapse? Yes and no; their vote share dipped by only 0.5. In some seats they held steady and piled on votes, they even gained Dumfriesshire and Eastwood which were notionally Tory. What happened was a collapse in the Lib Dem one year into their ill-fated coalition with the Tories. That vote en masse, plus a dip in Tory support went to the SNP allowing them to steamroll across a multitude of seats. The effect, as you can see is brutal. In the central belt the pattern of Labour held wards correlates somewhat to the residual mining heritage towns and areas of Catholic strength. A much more far reaching demographic 'resorting' wouldn't happen until after the 2014 referendum. The swings against Labour were however strongest in their strongest areas. In Ayrshire there's close to a wipeout for example. In Glasgow the SNP haven't yet reached the dizzy heights of 2015; they win in more 'genteel' parts of the city in the West End, in Baillieston and of course south of the Clyde, Sturgeon's support bleeds out into most of the southside. In Edinburgh the SNP sweep through, except in Edinburgh Northern where Labour happen to hold on. In Aberdeen, both Labour and the Lib Dems take a hit. |
|
DrW
Conservative
Posts: 578
|
Post by DrW on Jul 31, 2020 10:45:06 GMT
Interesting that the Tories win the West End ward 1979 - 1992 in Dundee but do not win Broughty Ferry. Presumably though the Conservatives would have won the latter in 2017 going by the local elections that year?
|
|