|
|
Post by afleitch on Jul 31, 2020 12:40:13 GMT
Interesting that the Tories win the West End ward 1979 - 1992 in Dundee but do not win Broughty Ferry. Presumably though the Conservatives would have won the latter in 2017 going by the local elections that year? Demographic changes in Dundee plus the SNP being competitive in Dundee East; winning 1974-1983 and close second in 1987 makes The Ferry (which also had a small chunk in Angus East) SNP. The SNP also did poorly, if they even stood, in Dundee in the Regional elections except in Broughty Ferry, even if the Tories won there. So the model concentrates SNP strength in that part of the seat. |
|
|
|
Post by afleitch on Aug 2, 2020 17:32:18 GMT
2016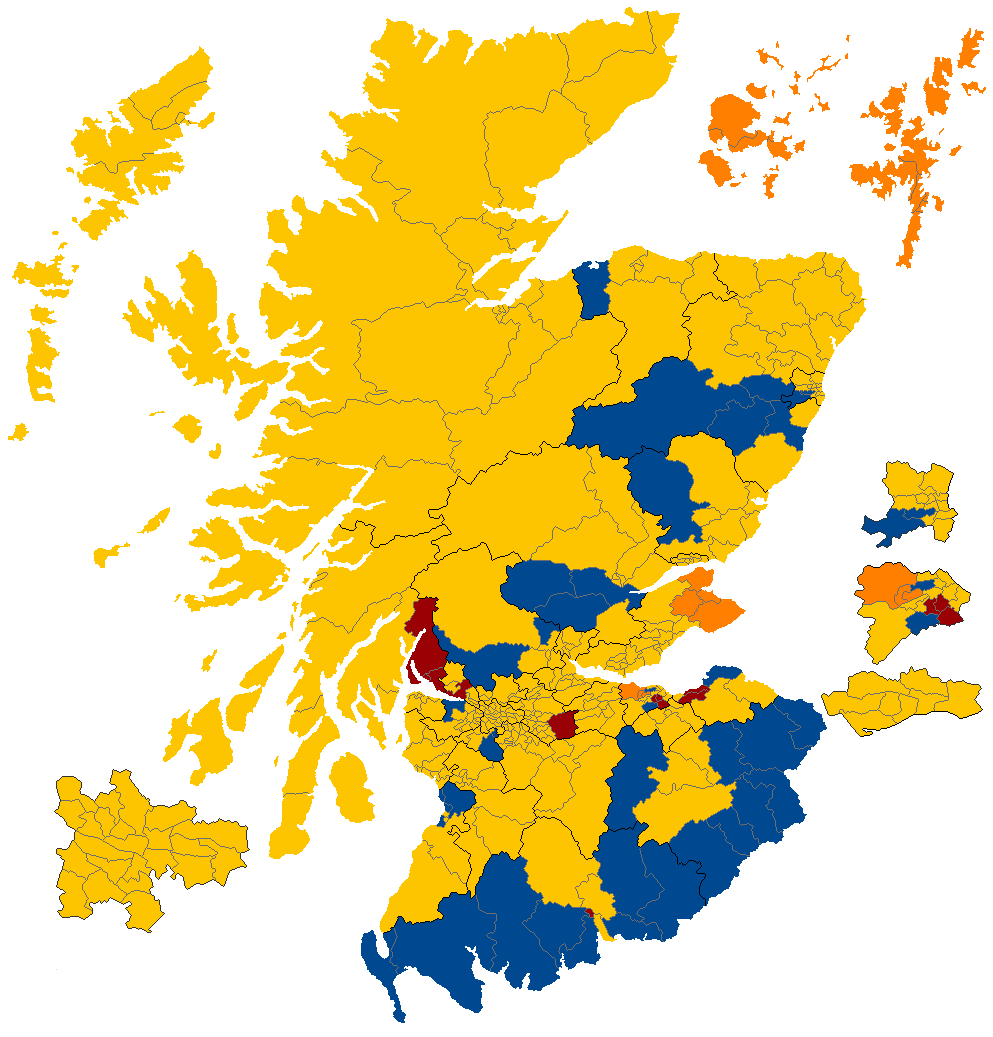 Labour collapse, coming first in just 11 wards mostly holding wards in the seats that they managed to hold onto. They are wiped out in Glasgow in it's entirety and in West Central Scotland almost completely. Now of course the 2017 GE gave a different scenario, but 2019 corrected that back towards a 2016 style result. It's not one way traffic however; the Lib Dems have seized North East Fife and Edinburgh Western. The Tories too drive huge swings against the SNP in much of the North East and in the Borders seizing a swathe of wards, a nod to what would lie ahead.
|
|
|
|
Post by No Offence Alan on Aug 2, 2020 17:38:44 GMT
Interesting how the Lib Dem strength in Edinburgh moved from West/ern to South/ern and back again.
|
|
|
|
Post by afleitch on Aug 2, 2020 17:40:39 GMT
So there we are. I will doubtless do the UK General Elections from 2001-2019 simply for both completeness and also to see the pattern of support in 2005 when the Lib Dems came in 2nd. I'm not happy with 1979 and 1974 simply because they aren't my own figures and it still bothers me  |
|
max11
Conservative
Posts: 41
|
Post by max11 on Aug 2, 2020 18:29:34 GMT
These are very interesting. Thank you!
|
|
iain
Lib Dem
Posts: 11,425  Member is Online
|
Post by iain on Aug 2, 2020 20:58:10 GMT
Given the levels of tactical voting, I’d have thought Labour would have been more likely to carry Haddington / Dunbar in East Lothian than the areas of traditional strength you have them ahead in?
|
|
|
|
Post by afleitch on Aug 2, 2020 21:35:54 GMT
Given the levels of tactical voting, I’d have thought Labour would have been more likely to carry Haddington / Dunbar in East Lothian than the areas of traditional strength you have them ahead in? East Lothian is a bit of a special case. The 2017 locals had SNP strength in Preston and Fa'side etc at the same rate (relatively) as the 2007 locals did. East Lothian in 2016 had a sizable Tory vote share which wasn't going to be found in wards like that. So my calculations had Labour strength strongest where it always with a three way tussle in the rural wards. Baxter's model for the 2017 GE, which was probably the most comparable result, had a similar spread. It was a seat held in 2011 and 2016 and gained in 2017 against expectations. So I admit it looks counter intuitive. |
|
Deleted
Deleted Member
Posts: 0
|
Post by Deleted on Aug 4, 2020 12:38:59 GMT
2016Labour collapse, coming first in just 11 wards mostly holding wards in the seats that they managed to hold onto. They are wiped out in Glasgow in it's entirety and in West Central Scotland almost completely. Now of course the 2017 GE gave a different scenario, but 2019 corrected that back towards a 2016 style result. It's not one way traffic however; the Lib Dems have seized North East Fife and Edinburgh Western. The Tories too drive huge swings against the SNP in much of the North East and in the Borders seizing a swathe of wards, a nod to what would lie ahead. These maps are the best thing I've seen on this site all year. Many thanks Afleitch! |
|
Clark
Forum Regular
Posts: 744
|
Post by Clark on Aug 5, 2020 20:44:41 GMT
Assume that red blob in the 2016 map between Glasgow and Edinburgh is Fortissat based on the town of Shotts?
|
|
|
|
Post by afleitch on Aug 6, 2020 15:47:12 GMT
Assume that red blob in the 2016 map between Glasgow and Edinburgh is Fortissat based on the town of Shotts? Yes. Time does stand still there |
|
|
|
Post by afleitch on Aug 11, 2021 14:47:21 GMT
So.
I've been scraping a lot of Election Study data and other such nuggets over the past few months. I feel a bit inclined to run the whole thing again, or at least make a few adjustments. One thing I should have done, certainly when I went back to the 1970's was bear in mind that certain wards didn't exist in terms that no one actually lived there, or there were no substantive pre-existing villages. Based on the 1971 Census, East Kilbride West, East Kilbride South, Cumbernauld North, Livingston North, Glenrothes North didn't 'exist' as the New Town's hadn't yet begun their last expansion. Inverness South effectively didn't exist either and of course Westhill and District as Westhill hadn't been developed. Newton Mearns North didn't really exist except in respect to Neilston village.
So in effect it would make sense to collapse those wards into neighbouring wards rather than give them a distinctive demographic or use a past voting result for a settlement that effectively hadn't been settled. By the 1980's of course this starts to change.
Though even as late as 1991, Inverness South for example was only a small settlement at Westhill (a different one) which is why Inverness looks somewhat strange in 1992.
Dummy runs of what I now have access to actually doesn't change too much from my initial maps, except of course in Highlands, Islands, Dumfries and Galloway and the Scottish Borders which have to rely much more on demographic trends due to non partisanship at swathes of elections as well as the 2007 data. How much weight I give to each shifts potential voting patterns which Alliance/Lib Dem dominance in some seats helps mask.
1974 and 1979 to a slightly lesser extent are more problematic as the SNP are a nightmare to model and the pattern of results depends on whether I tie it to the BBC/ITN Notionals (which I did last time), coupled with the 'ghost wards' I mentioned earlier.
So on the whole, I'm torn as to whether or not to give this a full bash again. And if I do, I need to get the actual data uploaded somewhere for people to play about with!
|
|
|
|
Post by afleitch on Aug 21, 2021 19:38:23 GMT
'Based on the 1971 Census, East Kilbride West, East Kilbride South, Cumbernauld North, Livingston North, Glenrothes North didn't 'exist' as the New Town's hadn't yet begun their last expansion. Inverness South effectively didn't exist either and of course Westhill and District as Westhill hadn't been developed. Newton Mearns North didn't really exist except in respect to Neilston village.'
Bit of painstaking work looking at census results, maps and 'Popchange', we can add to that both Bridge of Don ward in Aberdeen and Kincardine North in Aberdeenshire as being effectively non-existent for 1971. It doesn't mean there was no-one living there; but they may not have been effective political units. I am more confident that I can now give 1970 a bash, as well as 1966.
By 1981, all the aforementioned wards were effectively settled and growing except East Kilbride West, Inverness South and Cumbernauld North and by 1991 only Inverness South was relatively undeveloped.
I've also worked out figures to use for the new proposed wards that should hopefully be rubber-stamped later this month.
|
|
|
|
Post by afleitch on Aug 22, 2021 9:38:43 GMT
'Notionals'
A few thoughts.
Another possibility is tying the figures to the accepted 'notional' results for 1979 and 1992 and using that as a base line. As I've mentioned on here the 1979 notional's aren't bad, and were appraised pretty well after the 1983 results themselves. It is likely I will use the 1979 splits (which I have worked out) on a 'County to District Council' basis, but perhaps not the finer parts (ward splits etc)
The 1992 Notionals were based on the 1994 Regional results and while the methodology was similar, I think they got unlucky.
The part of Banff and Buchan that moved into Gordon for example was disproportionately Conservative (60% share in 1994) and likewise the part of Perth and Kinross moved into Ochil was disproportionately SNP (77% share in 1994). This happened in quite a few places; the part of Linlithgow and Livingston moved into Edinburgh West was really strongly SNP and the only ED it held in Edinburgh, the part of Hillhead moved into Anniesland was strongly Lib Dem and the only ED it held in Glasgow.
In short a lot of the simple and straightforward ED moves just so happened to involve ED's that had a voting behaviour very different from most of the seat/council it was in, often with a very strong and well known local candidate.
Where they stand down the following year for the first unitary elections (where the boundaries mostly matched) you can see this unwind which you could use to adjust the results.
|
|
|
|
Post by afleitch on Sept 10, 2021 13:01:28 GMT
Almost there...
A few points of note.
Alliance/Lib Dem and SNP support between 1979 and 1992 effectively acted as one third party. The difference being that the SNP took a larger share of that support in areas where there was a lower % of middle class/professional managerial and the two parties didn't tend to target each others turf. The SNP in retrospect made the error in not doing so in 1992, as it could have made gains during the Lib Dem unwind.
In 1987 (with a small unwind in 1992), a sizable amount of that third party 'pot' in areas with the highest % professional/managerial shifted to Labour something that didn't happen in Northern/Midlands seats until 1997.
The sole key indicator of SNP support, if I had to pick one, was in 'rural' areas with low levels further education/professional qualifications which often overlapped with % working in agriculture; Moray, Banff and Galloway were the top three.
Strathclyde, if you're using any form of regression, really has to be treated almost like a different country.
There seems to be a good correlation in partisan areas between predicted party strengths and the 1982-1990 Regional Election results except in 'growth' areas, particularly in the Aberdeen periphery where swathes of predicted Tory support seem to be Alliance/Lib Dem though perhaps not as strongly as the 1992 notionals would have suggested.
|
|
Clark
Forum Regular
Posts: 744
|
Post by Clark on Sept 11, 2021 19:05:54 GMT
I imagine Labour would be lucky to be carrying any wards today - maybe Cowdenbeath at a push.
|
|
|
|
Post by aidanthomson on Sept 15, 2021 19:04:19 GMT
'Notionals' A few thoughts. Another possibility is tying the figures to the accepted 'notional' results for 1979 and 1992 and using that as a base line. As I've mentioned on here the 1979 notional's aren't bad, and were appraised pretty well after the 1983 results themselves. It is likely I will use the 1979 splits (which I have worked out) on a 'County to District Council' basis, but perhaps not the finer parts (ward splits etc) The 1992 Notionals were based on the 1994 Regional results and while the methodology was similar, I think they got unlucky. The part of Banff and Buchan that moved into Gordon for example was disproportionately Conservative (60% share in 1994) and likewise the part of Perth and Kinross moved into Ochil was disproportionately SNP (77% share in 1994). This happened in quite a few places; the part of Linlithgow and Livingston moved into Edinburgh West was really strongly SNP and the only ED it held in Edinburgh, the part of Hillhead moved into Anniesland was strongly Lib Dem and the only ED it held in Glasgow. In short a lot of the simple and straightforward ED moves just so happened to involve ED's that had a voting behaviour very different from most of the seat/council it was in, often with a very strong and well known local candidate. Where they stand down the following year for the first unitary elections (where the boundaries mostly matched) you can see this unwind which you could use to adjust the results. I agree with your point about the 1992 notionals. It was a particular problem in places where there was a tradition of split tickets between local and national elections, particularly LD/Con splits, a feature of two of the examples you give, and some other places too: Renfrewshire West/Greenock & Inverclyde, for instance. Had constituencies like Dunfermline West, Edinburgh South or Strathkelvin & Bearsden been broken up (or broken up more than they were) this could have skewed the figures quite a bit. Re Gordon (and apologies if this has been discussed in depth in the past): do you know Rossiter, Johnston and Pattie's 1997 article in the British Journal of Political Science on redistricting ? They adopted a census-based regression approach to estimating notional results - basically MRP - rather than the R&T local election-based one, and they estimated that the 'new' Gordon in 1992 would have had a Con majority of 8.7%, rather than R&T's 20.8%. I suspect those figures might well have been more accurate, given the Con and LD vote share changes from R&T notionals in Grampian in 1997, arranged here from best to worst for Con: Aberdeen North: Con -3.6%, LD -9.7% Aberdeen Central: Con -9.3%, LD +2.6% Aberdeenshire West & Kincardine: Con -10.2%, LD +6.4% Banff & Buchan: Con -10.9%, LD +0.1% Aberdeen South: Con -11%, LD +1% Moray: Con -11.5%, LD +3.2% Gordon: Con -22%, LD +15.4% The fall in the Con vote in Aberdeen North was noticeably below average and in Gordon noticeably above. Similarly, the LD fall in Aberdeen North was unique and substantial, whereas the rise in Gordon was very high. So might a simple explanation be that the parts of Gordon moved into Aberdeen North, that is Dyce and Bridge of Don, were substantially more Con than the R&T notional suggested and substantially less LD, something that wouldn't be apparent in a local election results-based system, given LD strength and Con weakness in those areas, but might under MRP. (Of course, there could well have been other factors behind the LD result in Aberdeen North, such as tactical unwind, and the relatively good Con result might be because the party had less support to lose initially.) |
|
|
|
Post by afleitch on Sept 16, 2021 9:26:26 GMT
Your analysis is spot on, and close to what I've determined (I have a copy of the alternate notionals you mentioned). The issue with Aberdeen North is as you say; amplifying strong Lib Dem results locally into a national election. There were of course Labour voters in Dyce, Bucksburn, Bridge of Don etc that while in the Gordon seat probably were voting Lib Dem, but Labour's presence in Gordon wasn't negligible between 1983 and 1992 and this shift wouldn't account for their rapid advance in 1997.
|
|
|
|
Post by hullenedge on Sept 16, 2021 10:00:26 GMT
Your analysis is spot on, and close to what I've determined (I have a copy of the alternate notionals you mentioned). The issue with Aberdeen North is as you say; amplifying strong Lib Dem results locally into a national election. There were of course Labour voters in Dyce, Bucksburn, Bridge of Don etc that while in the Gordon seat probably were voting Lib Dem, but Labour's presence in Gordon wasn't negligible between 1983 and 1992 and this shift wouldn't account for their rapid advance in 1997. You'll be aware that the late Bill Miller pioneered census driven notional calculations. Sadly the method was sidelined by performance at local government elections. |
|
|
|
Post by afleitch on Sept 16, 2021 10:28:28 GMT
Your analysis is spot on, and close to what I've determined (I have a copy of the alternate notionals you mentioned). The issue with Aberdeen North is as you say; amplifying strong Lib Dem results locally into a national election. There were of course Labour voters in Dyce, Bucksburn, Bridge of Don etc that while in the Gordon seat probably were voting Lib Dem, but Labour's presence in Gordon wasn't negligible between 1983 and 1992 and this shift wouldn't account for their rapid advance in 1997. You'll be aware that the late Bill Miller pioneered census driven notional calculations. Sadly the method was sidelined by performance at local government elections. It's getting the balance right. When I ran Gordon in 1992, one set of the results had the Lib Dems way ahead in Gordon proper and the Tories ahead in the Aberdeen part. Not only was this contrary to local election patterns but also from some of the articles/statements at that time about where Malcolm Bruce's team thought their vote was. Angus is an interesting one. Because I have actual results from 2007 when Andrew Welsh stood, and as he was the candidate/victor on and off right through from the 70's, I haven't completely chucked out patterns of support that he clearly would have massed over several decades. |
|
|
|
Post by hullenedge on Sept 16, 2021 11:42:07 GMT
You'll be aware that the late Bill Miller pioneered census driven notional calculations. Sadly the method was sidelined by performance at local government elections. It's getting the balance right. When I ran Gordon in 1992, one set of the results had the Lib Dems way ahead in Gordon proper and the Tories ahead in the Aberdeen part. Not only was this contrary to local election patterns but also from some of the articles/statements at that time about where Malcolm Bruce's team thought their vote was. Angus is an interesting one. Because I have actual results from 2007 when Andrew Welsh stood, and as he was the candidate/victor on and off right through from the 70's, I haven't completely chucked out patterns of support that he clearly would have massed over several decades. Glad to hear that you have retained that material. Copied table 8.5 from The Boundary Commissions (Rossiter, Johnston & Pattie):-  There was an eight seat difference in 1992 for Con/Lab between the census method and R&T. Sadly in depth details not provided. |
|