|
|
Post by ccoleman on Nov 5, 2017 12:41:37 GMT
Well, that's very convincing, thanks. Still doesn't detract from my point that deprivation levels are not necessarily a reflection of average income, and therefore don't tell you what you think they tell you. For a start, in UK right now Income and Wealth are no longer as related to each other as they may have done in the past. As I've said elsewhere, it's pretty certain that the average Leave voter has more wealth than the average Remain voter, even if in all likelihood the average Remain voter has a higher income. This is simply a reflection of the age demographic of voters vis-a-vis patterns of Capital Ownership, especially that of housing. Note here that I'm only referring to averages, both sides contain complex multitudes. As for the problems with the ABC1C2DE system, there are many problems with it so I suggest start reading here. Also if we are allowing ourselves to use Ipsos-Mori after election polls, I suggest we should look at this: 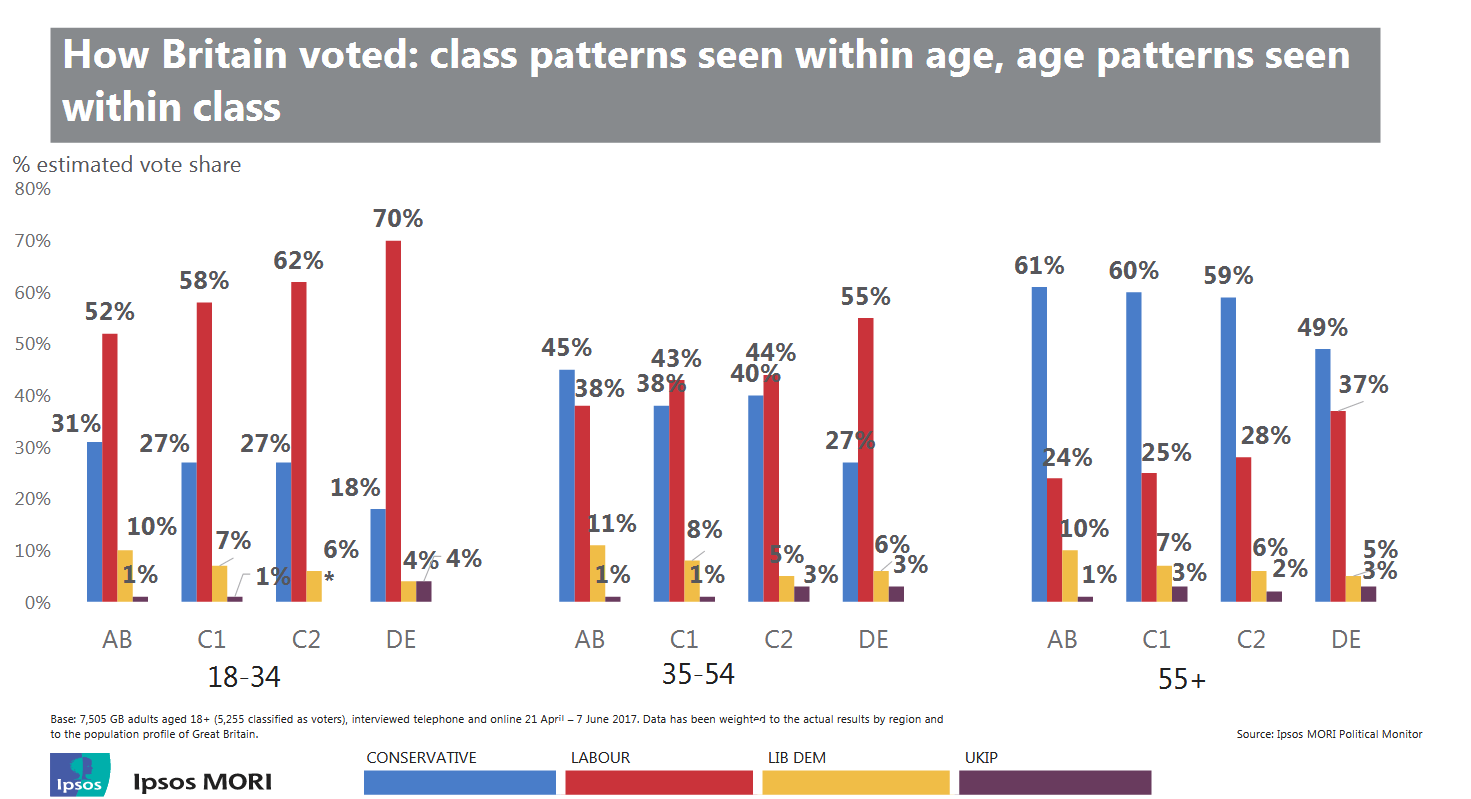 Well, yes - but I never mentioned wealth. I only specifically mentioned income. Just because a person or family has more wealth in the form of assets doesn't necessarily make them better-off in day-to-day life. You can look at this on a country-wide basis, with places like Italy being more asset-rich than Germany or Sweden, because Italians are much more likely to own their own home, but this is of course a pretty meaningless statistic, as you'd be hard-pressed to describe the average Italian as being better-off than the average German or Swede just because they own more capital. And I was already aware that pensioners are included with DE, which I agree is pretty silly but that hardly discredits the entire thing. Also, at no point did I say there was no link between income and deprivation - of course less-deprived constituencies in general will have higher incomes but there are plenty of exceptions to this rule, is the point I was making - and either way we don't know how people of different incomes voted in each constituency. |
|
sirbenjamin
IFP
True fame is reading your name written in graffiti, but without the words 'is a wanker' after it.
Posts: 4,979 
|
Post by sirbenjamin on Nov 9, 2017 17:31:09 GMT
For a start, in UK right now Income and Wealth are no longer as related to each other as they may have done in the past. As I've said elsewhere, it's pretty certain that the average Leave voter has more wealth than the average Remain voter, even if in all likelihood the average Remain voter has a higher income. This is simply a reflection of the age demographic of voters vis-a-vis patterns of Capital Ownership, especially that of housing. Note here that I'm only referring to averages, both sides contain complex multitudes. As for the problems with the ABC1C2DE system, there are many problems with it so I suggest start reading here. Also if we are allowing ourselves to use Ipsos-Mori after election polls, I suggest we should look at this:  Well, yes - but I never mentioned wealth. I only specifically mentioned income. Just because a person or family has more wealth in the form of assets doesn't necessarily make them better-off in day-to-day life. You can look at this on a country-wide basis, with places like Italy being more asset-rich than Germany or Sweden, because Italians are much more likely to own their own home, but this is of course a pretty meaningless statistic, as you'd be hard-pressed to describe the average Italian as being better-off than the average German or Swede just because they own more capital. And I was already aware that pensioners are included with DE, which I agree is pretty silly but that hardly discredits the entire thing. Also, at no point did I say there was no link between income and deprivation - of course less-deprived constituencies in general will have higher incomes but there are plenty of exceptions to this rule, is the point I was making - and either way we don't know how people of different incomes voted in each constituency. There is often some confusion around this. Only pensioners exclusively reliant on the state pension are grade E. For anyone with a company or private pension, they remain the grade of the last job they did that provides their pension. So a retired High Court Judge is still an A, not an E. A retired middle manager remains a B etc. |
|
Sibboleth
Labour
'Sit on my finger, sing in my ear, O littleblood.'
Posts: 16,025
|
Post by Sibboleth on Nov 9, 2017 17:45:43 GMT
Most polling firms group nearly all pensioners into category E. Certainly Ipsos-MORI do - I checked this a few months go - and its their figures that are the demi-official ones (proper demographic exit poll data not actually existing in the U.K).
|
|
|
|
Post by Ghyl Tarvoke on Dec 10, 2017 23:02:49 GMT
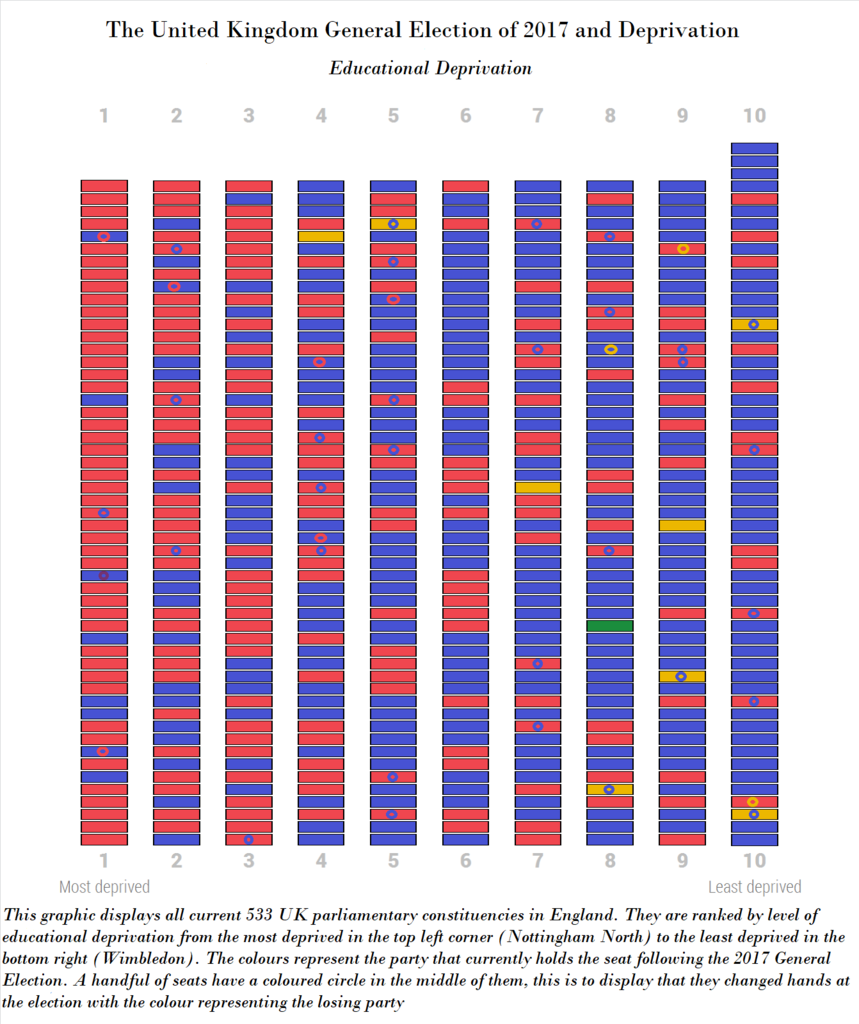
I'm bumping this thread as I plan to add to something to do it soon and a few more graphics of a similar type. First, here's the OP EU referendum graphic but cleaned up and errors corrected. 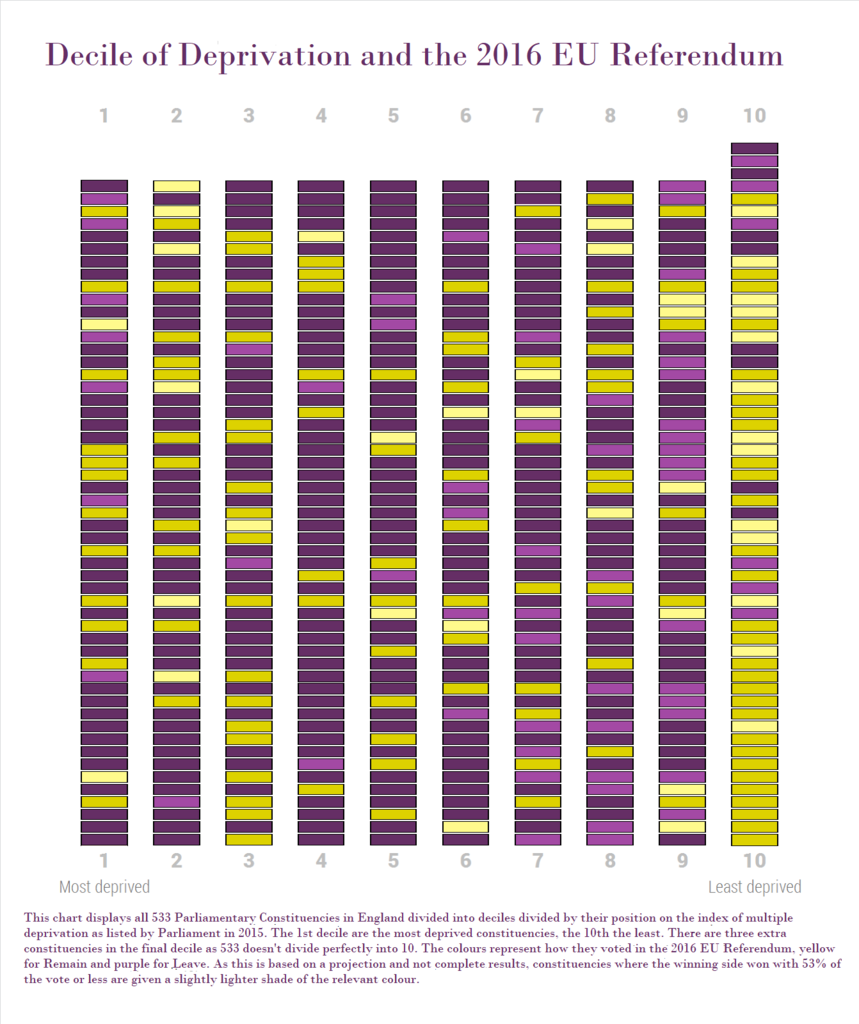 The second is one I created using educational deprivation alone as the measurement rather than the multiple index. This is designed to be a measure of educational attainment and opportunity in a particular area, here constituencies. More stark, no? 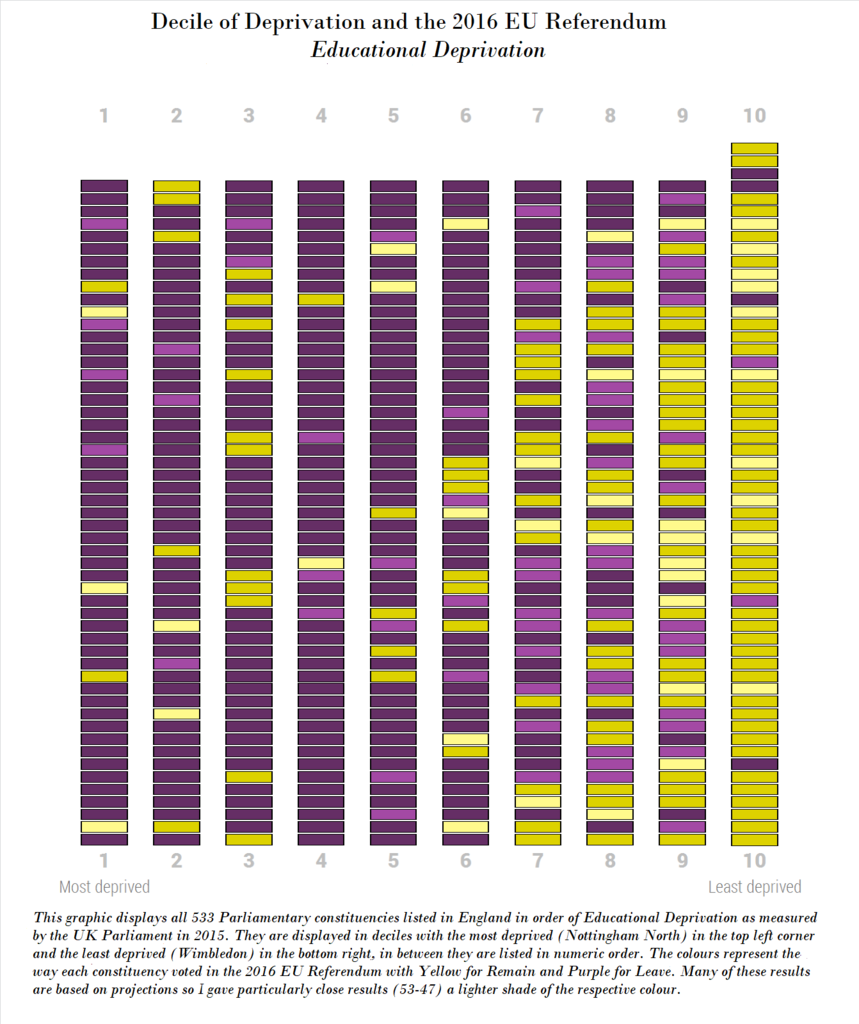 The Outliers (here listed from more to least deprived in each) 1st Decile: Bradford West Leeds Central Bristol South Birmingham Ladywood Newcastle Central 10th Decile: Haltemprice and Howden Ribble Valley Solihull Sutton and Cheam Sutton Coldfield Wyre and Preston North |
|
iain
Lib Dem
Posts: 11,426 
|
Post by iain on Dec 10, 2017 23:38:10 GMT
I understand Scotland and Northern Ireland, but why have you left Welsh constituencies out of your figures?
|
|
|
|
Post by Ghyl Tarvoke on Dec 10, 2017 23:39:45 GMT
Because they are listed separately by parliament. The spreadsheet I have only counts England.
|
|
|
|
Post by Ghyl Tarvoke on Dec 12, 2017 22:47:42 GMT
|
|
|
|
Post by Ghyl Tarvoke on Dec 26, 2017 2:06:43 GMT
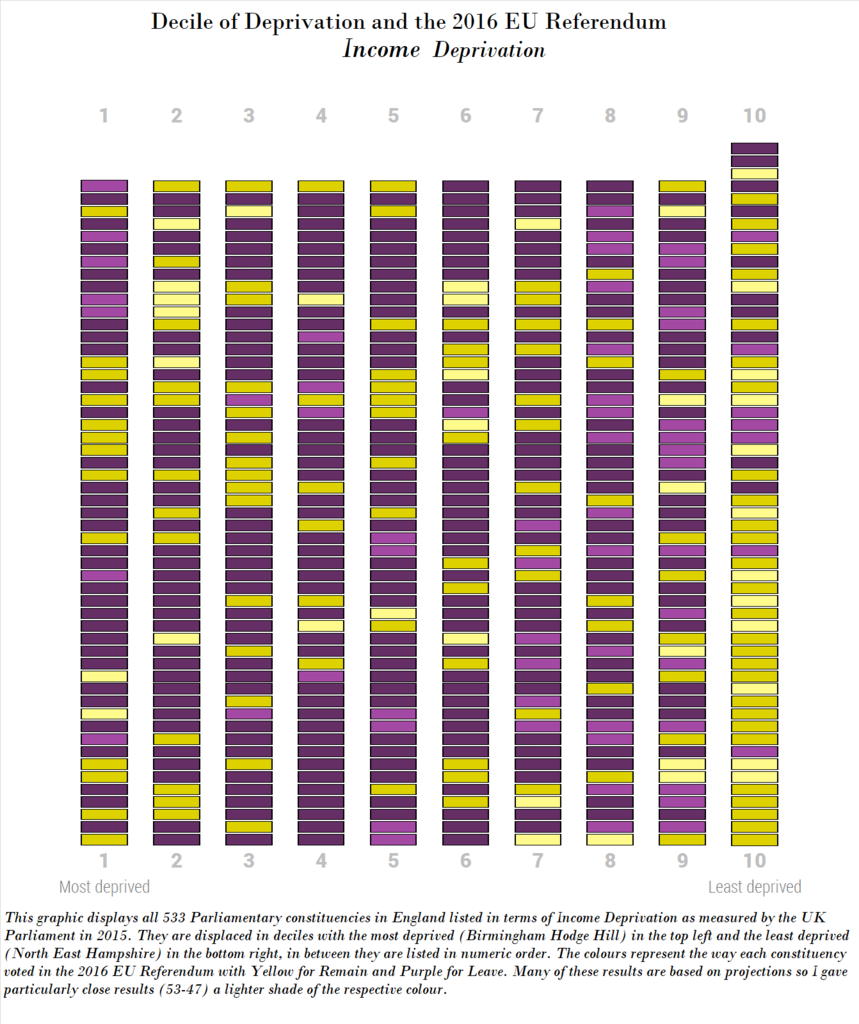 Will write up something about this later. Anyone here know why South Northamptonshire stands out exactly? It's the least deprived leave voting seat. |
|
Deleted
Deleted Member
Posts: 0
|
Post by Deleted on Dec 26, 2017 7:32:27 GMT
 Will write up something about this later. Anyone here know why South Northamptonshire stands out exactly? It's the least deprived leave voting seat. Something to do with Leadsom? |
|
Deleted
Deleted Member
Posts: 0
|
Post by Deleted on Dec 26, 2017 8:11:39 GMT
Two things I’ve noticed.
The Conservatives lost the 17th most Remain-voting seat (Battersea) and gained the 18th most Remain-voting seat (East Renfrewshire).
If the swing in Mansfield had been replicated in Stoke-on-Trent North and Dudley North the Conservatives would’ve taken those. They would also have pushed Great Grimsby to a recount.
|
|
|
|
Post by thirdchill on Dec 26, 2017 9:33:41 GMT
 Will write up something about this later. Anyone here know why South Northamptonshire stands out exactly? It's the least deprived leave voting seat. One of the most striking things is that there is little/no pattern in this at all. For 9 deciles, there is no trend, indeed there is more remain-voting seats in the 1st decile than the 9th decile. Presume a lot of those 1st decile remain-voting seats are in cities. You can see where Remain lost in the referendum. They really should have got more of the vote in the seats that are in the 5th to 9th deciles. It is only the 10th decile where the remain vote really shoots up. |
|
|
|
Post by hullenedge on Dec 26, 2017 11:44:52 GMT
It's a pity that 'Labour Leavers' are underrepresented on this forum as it would be refreshing to hear an alternative view (same applies to Tory Remainers). The local Tories were taunting Holly Lynch and her supporters that Halifax voted for Brexit thanks to her voters. She doesn't bite but the accusation is never denied. It is difficult to ascertain the true strength of Labour Leave in The North. Taking this year's election stats and assuming 66% of Tories voted for Leave (that's something of a bludgeon) the following figures were calculated for % Labour Leave:-  This calculation may be way off beam but it 'smells right' for my area. |
|
|
|
Post by Ghyl Tarvoke on Dec 26, 2017 13:25:04 GMT
Below the 9th Decile, pretty much all the Remain voting seats are in Urban areas or Uni towns. Above that, you have the wealthiest parts of the South and in some other regions like Rushcliffe, Hallam, and York Outer. So a list below:
Remain voting seats in the 1st Decile (Listed in order from most to least deprived):
Birmingham Ladywood
Tottenham
Edmonton
Birmingham Hall Green
Manchester Central
Bethnal Green and Bow
Bradford West
Hackney South and Shoreditch
Poplar and Limehouse
Leeds Central
Newcastle Upon Tyne Central
Manchester Gorton
Nottingham East
Camberwell and Peckham
Brent Central
In the 2nd Decile:
Liverpool Wavertree
Garston and Halewood
Islington North
West Ham
Wythenshawe and Sale East
Enfield North
Liverpool Riverside
Wallasey
Hackney North and Stoke Newington
Westminster North
Walthamstow
East Ham
Islington South and Finsbury
Bristol South
Croydon North
Leicester South
Lewisham, Deptford
Holborn and St Pancras
Leave voting seats in the 10th Decile
South Leicestershire
Stone
Thornbury and Yate
East Surrey
Derbyshire Dales
Richmond (Yorkshire)
Wyre and Preston North
Rutland and Melton
Ribble Valley
Skipton and Ripon
Saffron Walden
Arundel and South Downs
Mid Bedfordshire
Fareham
Haltemprice and Howden
Surrey Heath
South Northamptonshire
One thing I keep noting about this is how much light purple there is the 9th Decile. Sort of related, I reckon that if data exists on this, the most variable that probably is most predictive of the vote is house prices controlled for local purchasing power. However, doing this would reveal at least two notable outliers - the strength of Leave in Home Counties and the strength of Remain in Merseyside and a handful for poor often heavily ethnic minority districts.
|
|
Deleted
Deleted Member
Posts: 0
|
Post by Deleted on Dec 26, 2017 17:38:00 GMT
It's a pity that 'Labour Leavers' are underrepresented on this forum as it would be refreshing to hear an alternative view (same applies to Tory Remainers). The local Tories were taunting Holly Lynch and her supporters that Halifax voted for Brexit thanks to her voters. She doesn't bite but the accusation is never denied. It is difficult to ascertain the true strength of Labour Leave in The North. Taking this year's election stats and assuming 66% of Tories voted for Leave (that's something of a bludgeon) the following figures were calculated for % Labour Leave:-  This calculation may be way off beam but it 'smells right' for my area. Whats your leave % LD and UKIP? Personally i'd go for 30% and c. 95% |
|
J.G.Harston
Lib Dem
Leave-voting Brexit-supporting Liberal Democrat
Posts: 14,759 
|
Post by J.G.Harston on Dec 26, 2017 17:45:07 GMT
It's a pity that 'Labour Leavers' are underrepresented on this forum as it would be refreshing to hear an alternative view (same applies to Tory Remainers). The local Tories were taunting Holly Lynch and her supporters that Halifax voted for Brexit thanks to her voters. She doesn't bite but the accusation is never denied. It is difficult to ascertain the true strength of Labour Leave in The North. Taking this year's election stats and assuming 66% of Tories voted for Leave (that's something of a bludgeon) the following figures were calculated for % Labour Leave:- ... This calculation may be way off beam but it 'smells right' for my area. Whats your leave % LD and UKIP? Personally i'd go for 30% and c. 95% 30% fits about right with my experience when I was discussing the referendum with LD members and supporters. It also fitted my back-of-an-envelope calculations that predicted a 50%/50% result. |
|
|
|
Post by Ghyl Tarvoke on Dec 26, 2017 18:08:30 GMT
In continuation - same data as above but for the GE: 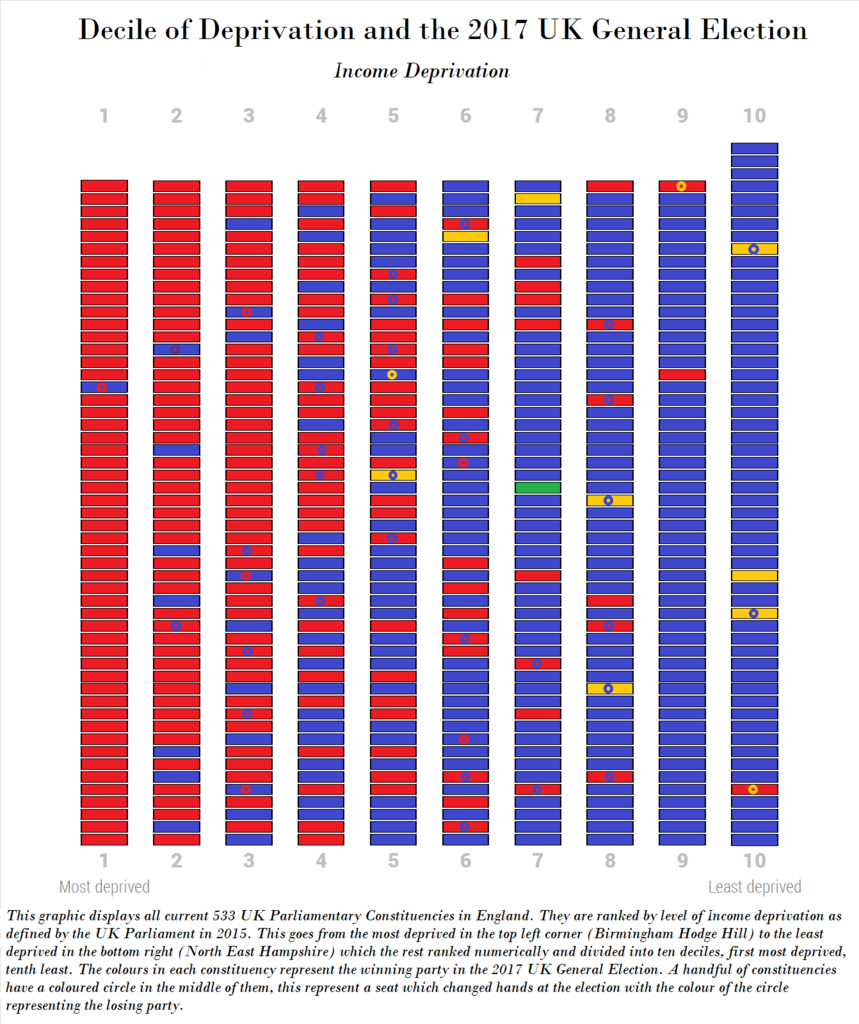 Most Deprived Conservative Constituencies: 1. Walsall North 2. Clacton 3. Telford 4. Blackpool North and Cleveleys 5. Hastings and Rye 6. Rochford and Southend East 7. Great Yarmouth 8. South Thanet 9. Torbay 10. Middlesbrough South and East Cleveland A few of their 2017 gains but mostly crap seaside towns. Least Deprived Labour Constituencies: 1. Sheffield Hallam 2. Cambridge 3. Leeds North West 4. Stroud 5. Warwick and Leamington 6. Sefton Central 7. Warrington South 8. Reading East 9. Penistone and Stockbridge 10. Canterbury Eight of these were gains in the election. Penistone strikes me as an outlier for a couple of reasons. |
|
Deleted
Deleted Member
Posts: 0
|
Post by Deleted on Dec 26, 2017 18:16:15 GMT
In continuation - same data as above but for the GE:  Most Deprived Conservative Constituencies: 1. Walsall North 2. Clacton 3. Telford 4. Blackpool North and Cleveleys 5. Hastings and Rye 6. Rochford and Southend East 7. Great Yarmouth 8. South Thanet 9. Torbay 10. Middlesbrough South and East Cleveland A few of their 2017 gains but mostly crap seaside towns. Least Deprived Labour Constituencies: 1. Sheffield Hallam 2. Cambridge 3. Leeds North West 4. Stroud 5. Warwick and Leamington 6. Sefton Central 7. Warrington South 8. Reading East 9. Penistone and Stockbridge 10. Canterbury Eight of these were gains in the election. Penistone strikes me as an outlier for a couple of reasons. I thought Mansfield, Plymouth Moor View and Stoke would make the top 10 list for most deprived Tory seats. Edinburgh South for least deprived Labour also. |
|
|
|
Post by Ghyl Tarvoke on Dec 26, 2017 18:19:15 GMT
This is England only. But yeah it would.
Also the measurement above is only for Income - there are other measurements (Education, Employment, Health, etc. I've already done Education and the general measurement which combines all the variables. They are also in this thread). As it happens for the Tories, if you go past ten it's
11. Plymouth, Moor View
12. Stoke on Trent South
13. North Thanet
14. Pendle
15. Sittingbourne and Sheppey
16. Mansfield
17. Halesowen and Rowley Regis
18. Dudley South
19. Waveney
20. Boston and Skegness
|
|
Deleted
Deleted Member
Posts: 0
|
Post by Deleted on Dec 26, 2017 18:40:14 GMT
This is England only. But yeah it would. Also the measurement above is only for Income - there are other measurements (Education, Employment, Health, etc. I've already done Education and the general measurement which combines all the variables. They are also in this thread). As it happens for the Tories, if you go past ten it's 11. Plymouth, Moor View 12. Stoke on Trent South 13. North Thanet 14. Pendle 15. Sittingbourne and Sheppey 16. Mansfield 17. Halesowen and Rowley Regis 18. Dudley South 19. Waveney 20. Boston and Skegness Thanks. So what would the lists look like if you included Scotland and Wales? |
|
YL
Non-Aligned
Either Labour leaning or Lib Dem leaning but not sure which
Posts: 4,905
Member is Online
|
Post by YL on Dec 27, 2017 10:02:12 GMT
It's a pity that 'Labour Leavers' are underrepresented on this forum as it would be refreshing to hear an alternative view (same applies to Tory Remainers). The local Tories were taunting Holly Lynch and her supporters that Halifax voted for Brexit thanks to her voters. She doesn't bite but the accusation is never denied. It is difficult to ascertain the true strength of Labour Leave in The North. Taking this year's election stats and assuming 66% of Tories voted for Leave (that's something of a bludgeon) the following figures were calculated for % Labour Leave:-  This calculation may be way off beam but it 'smells right' for my area. Well, the problem is that it just isn't plausible that the Tory Leave percentage was constant (or even close to it) and the Labour one varied that much. I would imagine that 2017 Tory voters in the most strongly Leave areas such as the coalfield and the Humber ports were way more than 66% Leave, whereas in places like Harrogate (not on the chart; are Remain voting constituencies omitted?) they'll have been less than that. |
|


