|
|
Post by Pete Whitehead on Jul 24, 2016 9:32:47 GMT
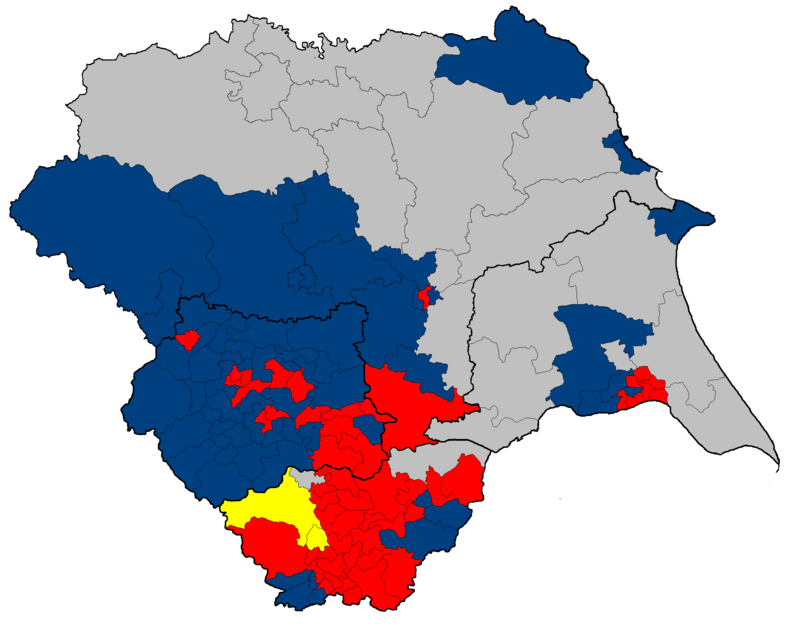
1976 | | | | Change | seats | change | | Con | 498565 | 40.5% | +9.3 | 75 | +35 | | Lab | 430822 | 35.0% | -5.4 | 54 | -26 | | Ind | 150606 | 12.2% | -2.7 | 19 | -5 | | Lib | 133272 | 10.8% | -2.0 | 2 | -4 | | NF | 13040 | 1.1% | +1.1 | | | | Oth | 5543 | 0.3% | -0.5 | | |
 |
|
Harry Hayfield
Green
Cavalier Gentleman (as in 17th century Cavalier)
Posts: 2,922 
|
Post by Harry Hayfield on Jul 24, 2016 9:34:09 GMT
I am sure that you have explained before, but either I cannot find it or it's been burrowed away somewhere, so you could explain again what these maps show and whether anyone can do their own versions?
|
|
|
|
Post by Pete Whitehead on Jul 24, 2016 9:39:01 GMT
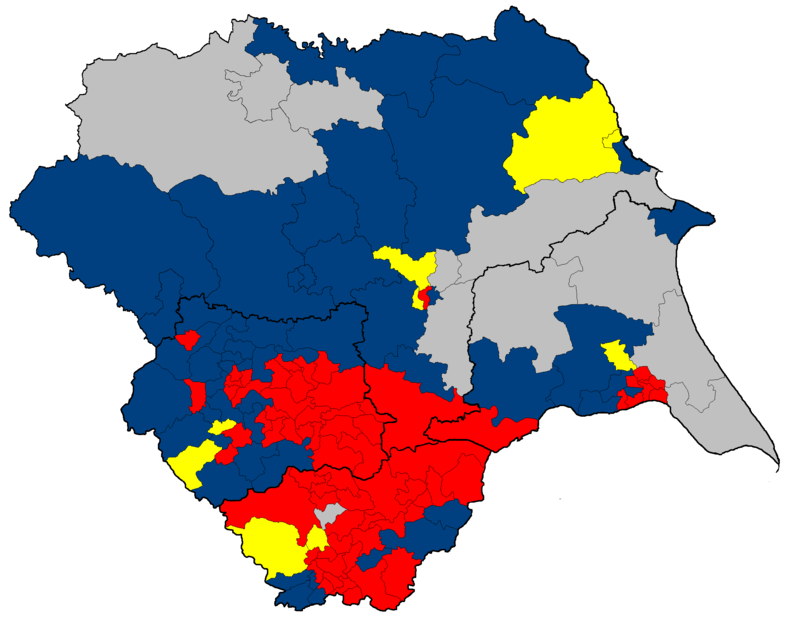
1979 | | | | Change | seats | change | | Lab | 1008723 | 43.4% | +8.4 | 77 | +23 | | Con | 830728 | 35.8% | -4.7 | 49 | -26 | | Lib | 275132 | 11.9% | +1.1 | 8 | +6 | | Ind | 190280 | 8.2% | -4.0 | 16 | -3 | | Oth | 16782 | 0.7% | -0.7 | | |
 |
|
|
|
Post by Pete Whitehead on Jul 24, 2016 9:42:46 GMT
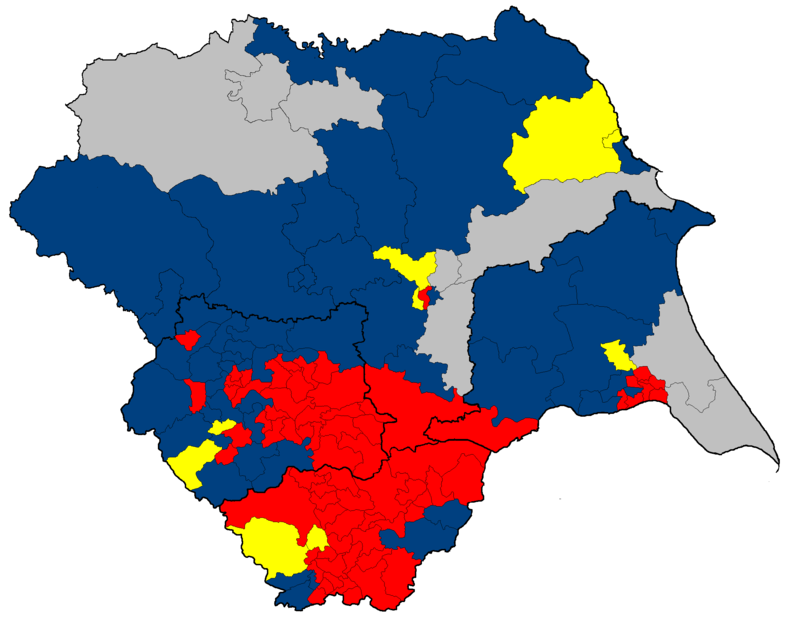
1983 | | | | Change | seats | change | | Lab | 576634 | 41.4% | -2.0 | 78 | +1 | | Con | 456745 | 32.8% | -3.0 | 55 | +6 | | All | 286785 | 20.6% | +8.7 | 9 | +1 | | Ind | 68313 | 4.9% | -3.3 | 8 | -8 | | Oth | 4532 | 0.3% | -0.4 | | |
 |
|
|
|
Post by Pete Whitehead on Jul 24, 2016 9:45:49 GMT
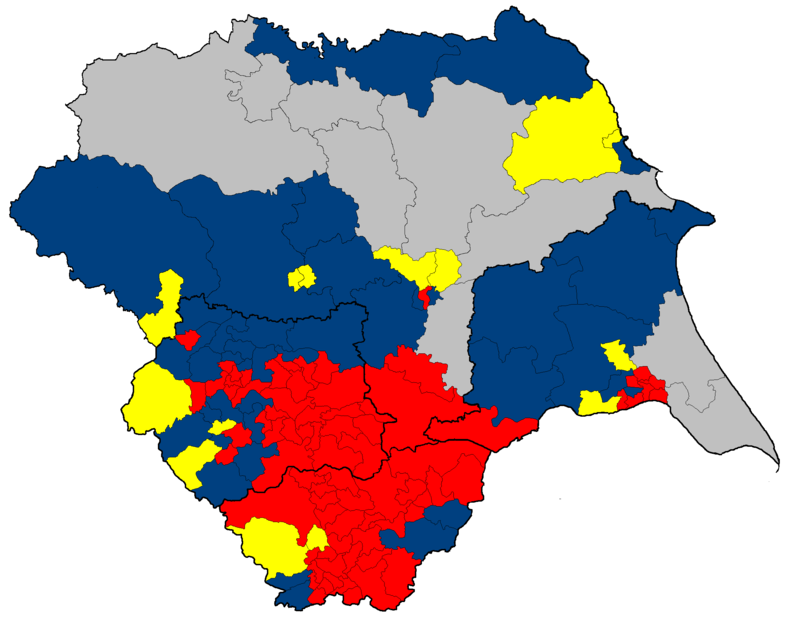
1987 | | | | Change | seats | change | | Lab | 585239 | 39.4% | -2.0 | 83 | +5 | | Con | 437072 | 29.5% | -3.3 | 44 | -11 | | All | 372515 | 25.1% | +4.5 | 14 | +5 | | Ind | 81053 | 5.5% | +0.6 | 9 | +1 | | Oth | 7806 | 0.5% | +0.2 | | |
 |
|
|
|
Post by Pete Whitehead on Jul 24, 2016 10:13:50 GMT
I am sure that you have explained before, but either I cannot find it or it's been burrowed away somewhere, so you could explain again what these maps show and whether anyone can do their own versions? IJABOF I think there is some explanation on the original thread here vote-2012.proboards.com/thread/752/landtag-elections-2011But to cut a long story short, it's imaginary regional assemblies, elected by FPTP with around 20k electors per seat with the results being aggregated from local elections from the relevant years. Of course anyone else can do their own versions |
|
|
|
Post by AustralianSwingVoter on Aug 30, 2016 1:44:44 GMT
What about Wales, Scotland and Northern Ireland?
and also I can't wait for the rest of the regions;
Essex-East Anglia
Sussex-Kent
East Mercia
London
Upper Wessex
Northumbria
Devon-Cornwall
West Mercia
Lower Wessex
|
|
|
|
Post by jollyroger93 on Aug 30, 2016 6:06:23 GMT
Out of curiosity Pete how do you come up with this constituencies and the overall election numbers?
|
|
|
|
Post by AustralianSwingVoter on Aug 30, 2016 6:34:17 GMT
Also, for Scotland and Wales I could do some boundaries for you if you could tell me the number of seats and what base them on (Historical Counties/Current Districts/Old Districts & Counties(Grampian/Strathclyde/Dyfed/Clwyd counties))
|
|