Deleted
Deleted Member
Posts: 0
|
Post by Deleted on Jul 2, 2013 8:25:58 GMT
This is more for the Fantasy Constituency thread really -   |
|
tricky
Lib Dem
Building a stronger economy and a fairer society so everyone can get on in life
Posts: 1,420
|
Post by tricky on Jul 2, 2013 19:47:14 GMT
Naughty boy! Leave the classroom and report to Mr. Tricky  Seriously, just stick Wirral Borough with the rest of the peninsular and the rest of Cheshire if you're struggling. You do not cross an estuary whose narrowest point is a mile wide! Ah, but we're using the current rules, which keep Counties together - otherwise I would have crossed into Cheshire  That's why I wasn't happy with it  I can keep doing this all day if needed....  |
|
|
|
Post by No Offence Alan on Jul 2, 2013 20:47:44 GMT
Regarding population-based constituencies. So, even if prisoners don't get the vote, the people living near the prison will get proportionately more electoral influence.
|
|
Clarko
Conservative & Unionist
Posts: 149 
|
Post by Clarko on Jul 3, 2013 7:31:03 GMT
|
|
|
|
Post by Dave Morgan on Jul 3, 2013 7:44:48 GMT
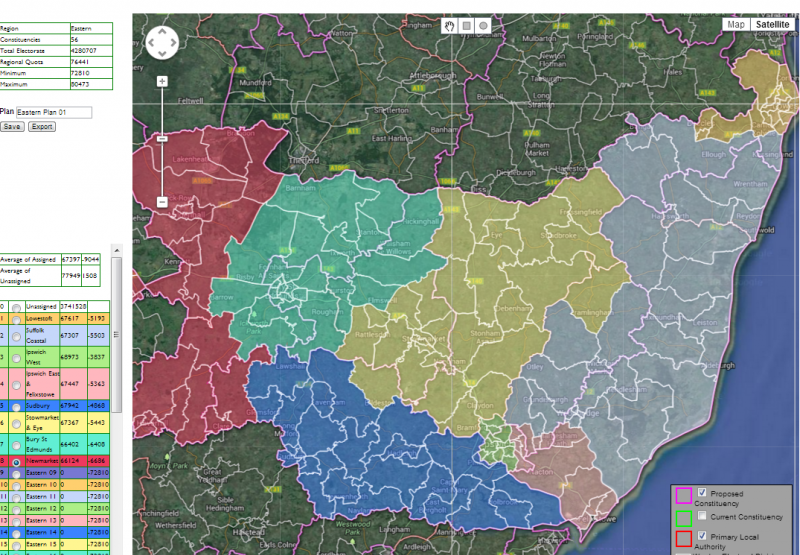
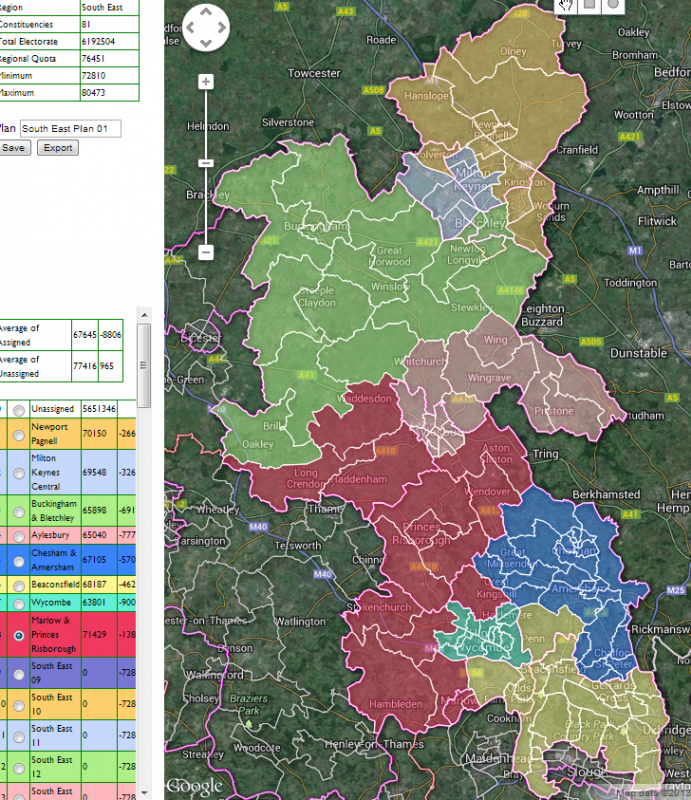
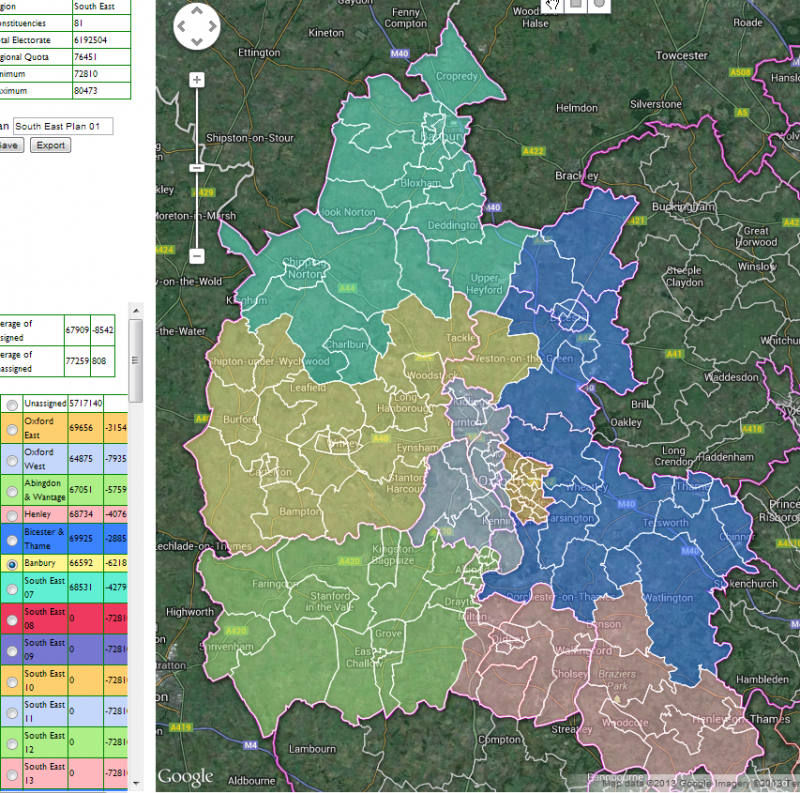
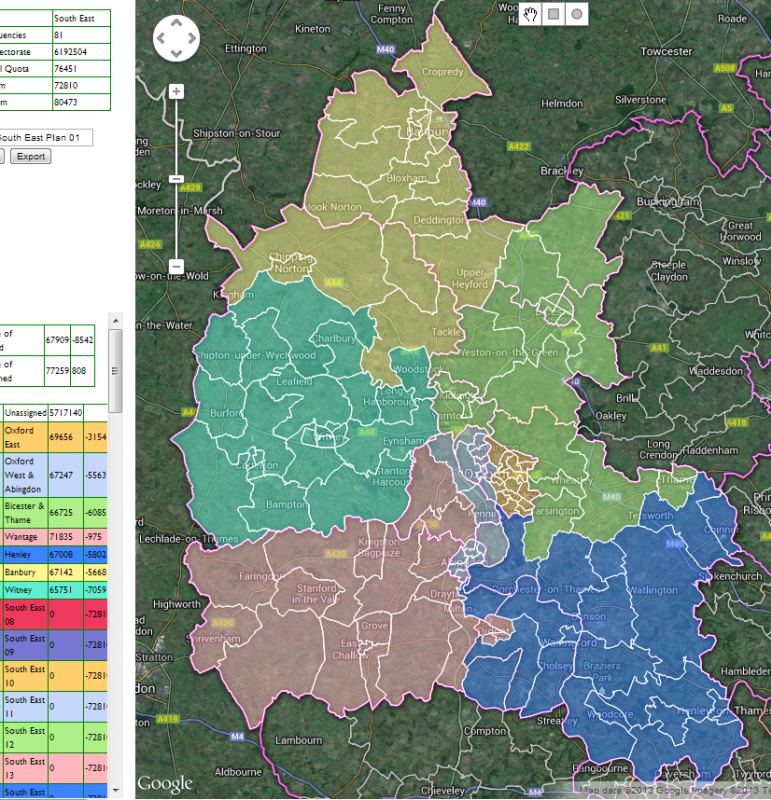
SOUTH WEST BANES 1.87 Bournemouth 1.84 Bristol 4.22 Cornwall and Scilly 5.81 Devon 8.14 Dorset 4.57 Gloucestershire 6.41 N Somerset 2.18 Plymouth 2.53* Poole 1.56* Somerset 5.69 S Glos 2.80 Swindon 2.12 Torbay 1.43* Wiltshire 4.86 Current allocations: BANES 2, Bristol 4, Cornwall 6, Devon and boroughs 12, Dorset and boroughs 8, Glos 6, N Somerset 2, Somerset 5, S Glos 3, Swindon 2, Wiltshire 5 The only main change here is Somerset gaining a seat. SOUTH EAST Berkshire 8.44 Brighton and Hove 2.70 Buckinghamshire 5.19 East Sussex 5.47 Hampshire 13.91 IOW 1.54* Kent 14.54 Medway 2.58 Milton Keynes 2.31* Oxfordshire 6.59 Portsmouth 1.99 Southampton 2.30* Surrey 11.47 West Sussex 8.35 Current allocations: Berkshire 8, Buckinghamshire 5, East Sussex and Brighton 8, Hampshire and Southampton 16, Kent and Medway 17, Milton Keynes 2, Oxfordshire 6, Portsmouth 2, Surrey 11, West Sussex 8 The main changes here are: (1) Milton Keynes goes back in with Buckinghamshire with the combined area being allocated eight seats (7.503). (2) Oxfordshire gains a seat. (3) The Isle of Wight can have a second seat if it wants one. EASTERN Bedford 1.56* Cambridgeshire 6.14 C Beds 2.67 Essex 14.49 Hertfordshire 11.26 Luton 1.76 Norfolk 9.03 Peterborough 1.66* Southend 1.75 Suffolk 7.52 Thurrock 1.52 Current allocations: Bedfordshire 6, Cambridgeshire and Peterborough 7, Essex and boroughs 18, Hertfordshire 11, Norfolk 9, Suffolk 7 There are extra seats here for Cambridgeshire and Suffolk. Just quickly looking (with little knowledge), what would the easiest way be. - Cambridgeshire - there's no areas with particularly oversized seats - a Mid-Cambridgeshire to the north of Cambridge? - Suffolk - Bury St Edmonds appears to be the most oversized. Shifting Central Suffolk & Ipswich North over (becoming Central Suffolk), and then creating a Ipswich North and Ipswich South? - Oxfordshire - creating an Abingdon seat from large parts of other seats, then creating an Oxford West and Oxford East seat - both with bits of other boroughs added to them? - Somerset - every seat appears quite oversized - a Mid-Somerset seat - Buckinghamshire - creating a Milton Keynes North, Milton Keynes East and Buckingham North & Milton Keynes South? |
|
|
|
Post by Davıd Boothroyd on Jul 3, 2013 8:25:52 GMT
The Isle of Wight could have had a second seat in the 1995 review if it had wanted one.
|
|
|
|
Post by Pete Whitehead on Jul 3, 2013 8:40:38 GMT
Just quickly looking (with little knowledge), what would the easiest way be. - Cambridgeshire - there's no areas with particularly oversized seats - a Mid-Cambridgeshire to the north of Cambridge? - Suffolk - Bury St Edmonds appears to be the most oversized. Shifting Central Suffolk & Ipswich North over (becoming Central Suffolk), and then creating a Ipswich North and Ipswich South? - Oxfordshire - creating an Abingdon seat from large parts of other seats, then creating an Oxford West and Oxford East seat - both with bits of other boroughs added to them? - Somerset - every seat appears quite oversized - a Mid-Somerset seat - Buckinghamshire - creating a Milton Keynes North, Milton Keynes East and Buckingham North & Milton Keynes South? 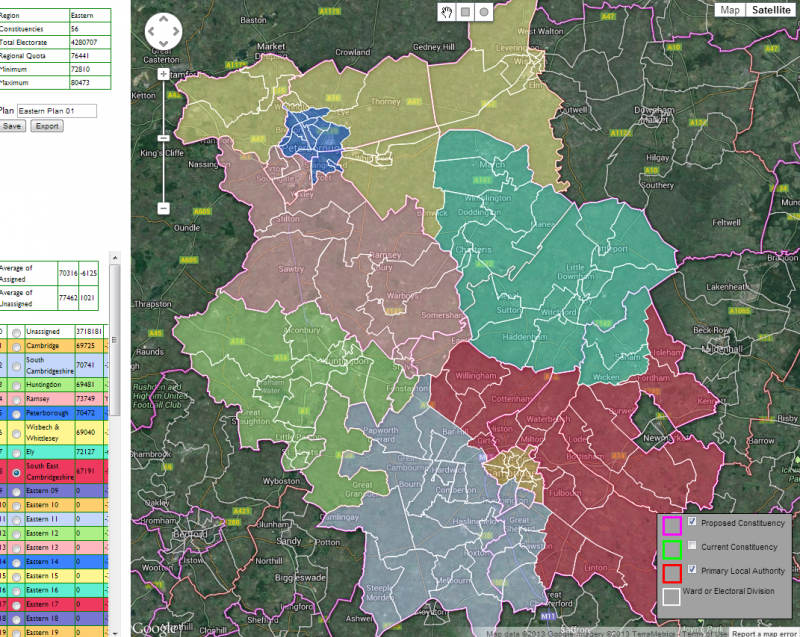 |
|
|
|
Post by Pete Whitehead on Jul 3, 2013 8:47:44 GMT
|
|
|
|
Post by Pete Whitehead on Jul 3, 2013 9:32:27 GMT
|
|
|
|
Post by Pete Whitehead on Jul 3, 2013 11:04:21 GMT
- Put Brent with Harrow for a 5 seat area (4.82), then put Hillingdon with Hounslow for another 5 seat area (4.91) |
|
|
|
Post by kevinlarkin on Jul 3, 2013 12:07:21 GMT
- Put Brent with Harrow for a 5 seat area (4.82), then put Hillingdon with Hounslow for another 5 seat area (4.91)  |
|
|
|
Post by Dave Morgan on Jul 3, 2013 17:08:37 GMT
Merseyside  |
|
Khunanup
Lib Dem
Portsmouth Liberal Democrats
Posts: 11,516
|
Post by Khunanup on Jul 3, 2013 18:16:33 GMT
Yep, that's the only way Wirral works without crossing the 'county' boundary. Should be Birkenhead and Bebington though, it's a biggest place than Bromborough (but less good obviously). |
|
|
|
Post by Dave Morgan on Jul 4, 2013 7:32:08 GMT
|
|
|
|
Post by lancastrian on Jul 4, 2013 12:02:12 GMT
Is there any way to tidy up Hounslow? Pinner and Stanmore probably looks a bit too much like a gerrymander- Harrow has been split East-West(and formerly Central) for ages(possibly always with two Harrow seats?). What would the majority be in that seat? I think it's around 12000 using the local election results.
|
|
|
|
Post by Davıd Boothroyd on Jul 4, 2013 13:29:46 GMT
Hounslow will always be difficult because of the boundaries of the borough, including the fact that the River Thames is a large part of it, and that linking through Heathrow airport isn't a good idea.
If the numbers worked (which they don't at present but might at some point soon), linking Hounslow and Ealing could produce logical constituencies. Chiswick and Acton would be a reasonably safe Conservative seat while Brentford and Ealing Central would be Labour.
|
|
|
|
Post by Andrew_S on Jul 4, 2013 13:41:03 GMT
|
|
|
|
Post by Pete Whitehead on Jul 4, 2013 13:44:51 GMT
Excellent. Now we can redo our calculations based on these figures. Might produce some different outcomes to Andrew's above. We could do with numbers for Scotland and Wales though*
*edit: we do.
Strange the second table only gives figure for each constituency though and not for districts and counties. It can be aggregated of course but requires a bit of work. We would also need the detail at ward level to be able to draw up fantasy seats on this basis
|
|
|
|
Post by kevinlarkin on Jul 5, 2013 7:15:18 GMT
Excellent. Now we can redo our calculations based on these figures. Might produce some different outcomes to Andrew's above. We could do with numbers for Scotland and Wales though* *edit: we do. Strange the second table only gives figure for each constituency though and not for districts and counties. It can be aggregated of course but requires a bit of work. We would also need the detail at ward level to be able to draw up fantasy seats on this basis This has the latest electorate data aggregated by county. Parliamentary Electorates 2009 to 2012 |
|
|
|
Post by Pete Whitehead on Jul 5, 2013 7:17:10 GMT
Thanks lol.. I wish you could have posted this last evening as I spent an hour or so aggregating the county figures from the constituencies
|
|


 That's why I wasn't happy with it