Here's something I wrote and hope to release somewhere soon. May be errors, spellings, etc... Feedback appreciated. Links broken, may fix them laterIt’s now over a year since Paul Nuttall was elected leader of UKIP. At the time, while their polling had dipped from the highs of the pre-referendum periods, UKIP were still running at about the same level as they had in the previous election,
between 10 and 14 percent. In the period since UKIP has effectively collapsed as an organization, the June snap election saw them fall from 12.5% in 2015 to under 2% - a worse performance than 2010 when nobody considered them anything other than a minor player on the political landscape. Nuttall as leader quickly became a joke and resigned after the election, to be replaced by a total anonymity. There is currently no real sign of any UKIP recovery and their remaining councillors
are defecting to the Conservatives en masse or
losing their seats.
One of the many notable things about this sudden collapse is how little it was expected, at least by those paid to write about politics. Indeed when Nuttall, an MEP since 2009 and before that a University Lecturer who failed to complete his PhD on ‘The History of Conservatism in Liverpool’ who used Donald Trump as a positive model in his election victory speech and once advocated the privatisation of the NHS, was elected leader the assumption that his working class roots and supposedly working class manner would win over ‘dissatisfied Labour voters’ who voted Leave and disliked Jeremy Corbyn and his leadership as a Metrolib imposition on ‘true Labour values’ that supposedly Labour voters in the regions embodied. First and foremost of these regions was the North of England, which voted heavily to leave the EU and where UKIP had recorded some of their better electoral results in 2015 yet was still dominated by – a supposedly declining – Labour. Nuttall himself upon being elected Leader stated his objective was
“to replace the Labour party and make UKIP the patriotic voice of working people” citing the North of England as a place where this was most opportune for UKIP.
The press agreed.
The Huffington Post’s Owen Bennett described Nuttall’s victory in the UKIP leadership contest as the triumph of “working-class, patriotic, spit and sawdust politics” and that new leader spoke “the language of the ordinary man and does so with a smile on his face”. He dismissed UKIP’s poor performance in the Oldham West by-election as a fluke and saw Nuttall as a huge threat to Labour and predicted that UKIP could well win Leigh and Liverpool Walton (giving two examples) at the next election.
Nigel Morris in the I claimed the election of Nuttall would “send a shiver down the spine” of Labour MPs on “soft majorities” and that UKIP’s “populist insurgency” would destroy them in the North like the SNP did for Scottish Labour, citing research that Labour could lose 14 seats if one in fifty 2015 Labour voters switched to UKIP.
Harry Cole in the Sun claimed that Labour could lose up to 20 seats due to a “Working Class surge” until Nuttall and Labour’s “mess over Brexit policy”, these 20 included Doncaster Central and Don Valley. This was not exclusive to the press. Labour MP and tedious windbag Frank Field described Nuttall as
“the greatest threat Labour has ever faced”. Political Scientist and number one UKIP apologist on Twitter, Matthew Goodwin, predicted that UKIP could use the Death Penalty as way to win over Working Class voters.
He also predicted that Nuttall’s UKIP could take Heywood and Middleton, Great Grimsby, Rother Valley, Rotherham, Blyth Valley, Bolton South East, Ashton Under Lyne, Hull East, Hull West, South Shields and Makerfield from Labour.
And before we leave this, let’s not forget this
Anyway, needless to say none of this happened, and the Conservative party couldn’t take advantage of the Nuttall collapse either. Labour held all 15 of the above mentioned constituencies in the general election gaining an average of 4,303 votes from 2015 in them, an average increase in vote share of 7.4%. While some, especially in Yorkshire, swung to the Conservatives, in only two is Labour’s majority under 5,000 following the general election. In the most vulnerable of those, Great Grimsby, Labour still gained an increase of 9.6% in vote share, mirroring the national increase. In Greater Manchester it tended to be more than that, with an increase in vote share of 10.6% in Ashton Under Lyne the highest on the above list outside South Shields (10.8%). In Liverpool Walton, where Labour had apparently a lot to fear from Nuttall, the party won 86% of the vote.
The Idea of the NorthThe idea that the North of England is a uniquely vulnerable area for the Labour Party hardly began with Nuttall. Indeed this discourse probably peaked a few months before Nuttall’s accession following the Brexit referendum when the North voted strongly to Leave the EU. This apparently showed the strong rejection for the current Labour party for some unexplained reason*, gliding over facts like that the North was the strongest part for NO in England in the 1975 referendum, when most Labour MPs were against membership and that previous experiences of EU referenda in the UK and other countries suggest they don’t change normal voting patterns (see: Norway). But it hardly started then either. One of the
most popular political science books in recent years promoted the idea that the further right were a unique threat to Labour’s core vote, presumably older blue collar males with low level education living in peripheral towns with “socially conservative values”, who were believed to be plentiful in the North. The solution to this problem was for Labour to tack to the right on immigration and embrace cultural conservatism, such as groups like Blue Labour were demanding.
The reality that this narrative eluded – that as well as the Rotherhams and Hartlepools (both still comfortably Labour fwiw) of this world there were the Liverpools, the Manchesters and the Newcastles and that these places were much larger– was ignored. It also tended to ignore the even more obvious that could be looked at from an election swingometer – that UKIP’s vote in ‘Labour Heartlands’ in the North mostly came from Conservatives, Liberal Democrats and previous non-voters (Most Labour ‘ Northern Heartlands’ showed above average vote share increases in 2015, while the Tories fell and UKIP filled the gap left by the Lib Dems). Yet it had become conventional wisdom to such an extent that it may have brought about major political decisions. It’s quite possible Theresa May would not have called the snap election if she did not think that, following the Brexit referendum, Labour’s working class base was vulnerable to a nationalist and populist campaign. This would certainly explain some of her campaigning decisions,
such as spending the last week of the campaign touring safe Labour seats in South Yorkshire talking about immigration. Even while there was a small pro-Conservative swing in South Yorkshire, she still lost most of those seats by miles. In some places Labour’s vote reached levels not seen since 1997 - even in old mining seats - with Brexit and UKIP making little difference.
There are some who are still attributing that failure to May’s weak campaign and Corbyn’s triangulation on Brexit. Certainly those were factors but I think there’s a more simple explanation and it’s that Labour’s weakness in the North is a myth backed up by no statistical evidence worthy of the name. Indeed, as I have been hinting at so far, what the electoral record shows is much the opposite.
Voting in the North of England since 1955So far I’ve failed to define ‘The North’. This is largely because journalists and commentators fail to do so either, and also that ‘The North’ tends to refer more to a sort of imagined social ideal of English working class life rather than a geographical place. This is why discussions of the North can include places like Stoke and Mansfield whose Northern-ness is otherwise questioned and questionable. I, for simplicity’s sake, will take a simple definition: The North is what the UK government currently defines it as: the regions of the North-East, the North West and Yorkshire and the Humber. Everywhere else does not count. This also allows a straightforward analysis of electoral returns as since 1983 the regions have been used to draw constituency boundaries, and very few before then breached its boundaries.
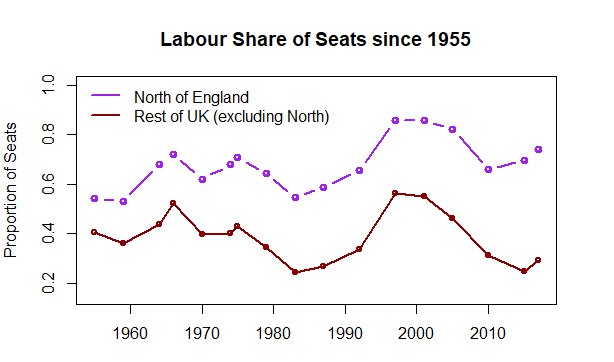
Using available (if not brilliantly organized) electoral data I’ve created a graph below showing the percentage of seats (expressed in ratio of total seats available) won at each general election by Labour since 1955. The first, purple, line shows the proportion of seats won in the North of England and the second, dark red, line the proportion of those won in the rest of the UK (yes, yes, I realize now I should have switched the colours). The x-axis lists years and the dots represent general elections. There are very likely to be some errors given how much information was transferred from different sources and how some numbers I have differ from official returns, albeit by amounts so small they’ll be statistically insignificant for an analysis like this. For before 1983, I’ve included any constituency that contained a significant part of the current North, such as the ‘Louth’ seat which contained Cleethorpes (currently the North) as well as the Lincolnshire town of Louth (currently East Midlands). Again, however, the differences are likely to be very small and will very closely resemble the full reality.

While what this shows is that Labour have in this period always done better in the North than the rest of the UK – and have always won a majority of seats in the North - the gap has grown considerably since the 1950s with Labour actually improving in the North of England as compared to elsewhere. This can be simply shown by a short analysis comparing the 2017 result to historic ones. Jeremy Corbyn actually outperformed all Labour leaders in the North of England since 1955 other than Tony Blair in percentage of seats won. This includes Harold Wilson when he won a near 100 majority in 1966 (74.05% of Northern seats were Labour in 2017, compared to 72.19% in 1966). This was not so much a fluke result, but rather the continuation of historic trajectory in which Labour’s support in the North has diverged from the rest of the country which started being noticeable in 1964 but starts accelerating from the 1970s onwards. Even when the North follows the national trend – and apart from 2015 it always has – and sees a fall in the number of Labour seats, this fall is less severe than elsewhere.

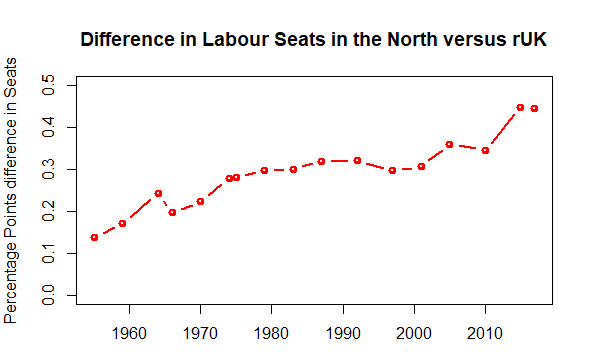
This graph shows more clearly the proportional difference between Labour in the North and elsewhere since 1955. The gap has grown bigger and bigger in seats won from a 14 point difference in 1955 to a 45 one sixty years later. Although I’ll add that the exceptional gaps for the last two elections are mostly – but not entirely - an artefact of the collapse of Scottish Labour.
Vote ShareNow you might be thinking “A ha, the data is a distortion due to First Past the Post, a vote share chart would show the depth of Labour’s decline in the North”. Well, buddy, I have your back

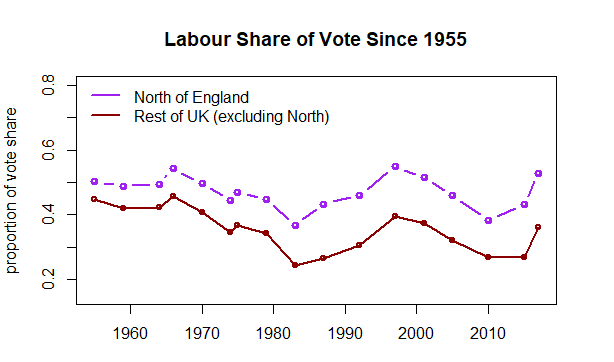
A vote share chart has, unlike the seats one, particular issues. Before 1974 in particular only two parties contested most constituencies which of course will lead to higher overall shares for both parties. Increasing the number in candidates, which was an increasing feature of British elections from the 90s onwards until it was somewhat reversed this year, is going to lead to smaller shares for the larger parties. This is why the actual numbers perhaps shouldn’t be focused on here so much as the trend and the difference between the North and the Rest of the UK.
And the trend is absolutely pointing upwards, between 2010 and 2017 Labour have put 14.6 points on their vote share in the North of England, compared to 9.2 points for the rest of the UK, leaving them with 52.93% for the North as a whole. The increase is such that only Harold Wilson in 1966 and Tony Blair in 1997 won a higher vote share in the North than Jeremy Corbyn did – and he was less than two points short. But already this vote share was creeping up under Ed Miliband. In 2015 Labour gained 5 points in the North from 2010 while being stationery in the rest of the country as a whole. Which doesn’t fit… the narrative, to put it mildly (even less fitting the narrative is that most of those gains were in their safe ‘heartlands’ seats, and not just the urban ones at that).
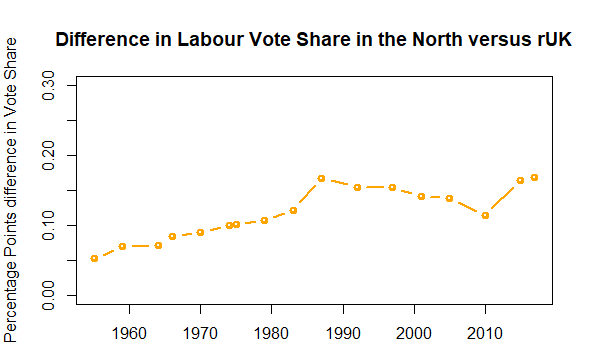
The pattern is otherwise familiar from the seat graph, the gap between the North and the rest expands very slowly in the 50s and 60s. Unlike the seat graph, it becomes very noticeable a bit later and very loud by 1987 – which at 16.75 points is the largest gap between the North and the rest of the UK… until this year (and then by .1 point), and unlike in 1987 the Liberals/the Alliance would not have had a huge distortionary effect. The size of the gap is charted below.
 One last thing
Now this is where you might go “But what about Vote Leave? That was more popular in the North than Labour, so that shows it is the future of politics in the region”. Now this isn’t wrong but the gap isn’t big. According to
Chris Hanretty’s constituency estimates Leave won 122 constituencies in the North of England. Jeremy Corbyn’s Labour in the June General Election won 117. A difference of five, and the former was a binary choice.
The TrendA 4% swing to Labour at the next election would see Labour gain 13 seats in the North on current boundaries. This would see them return to the level of seats they had under Tony Blair in this region but with only a tiny majority – and that’s with winning a fair bit of Scotland back. A swing of 4% in the other direction would see Labour losing 13 seats in the same region, but this would revert them to the level of seats they saw under Neil Kinnock in 1992 but this time with a massive Tory majority of 78 unlike the meagre one John Major got. Suffice to say that rather than stopping in the post-New Labour era, the trend for the North to move towards Labour has actually got stronger since the establishment of the Coalition. This is the real story of politics in the North of England since 2010, UKIP being mostly an overrated and misunderstood irrelevance.
If I get around it and if you don’t all hate me by now, I plan to write a part two looking at these changes in historical detail, positing causes and with statistical depth on why, no, Brexit changes precisely nothing.
(* - If it did resemble rejection of the Labour Party – and I don’t think it did - it was that of the party of Tony Blair, who promoted Eastern European accession to the EU and then did not restrict labour market access to these newcomers when they joined in 2004, certainly not of lifetime EU sceptic Jeremy Corbyn, yet those same people pushing this narrative of those who think a Blairite electoral strategy is the only way to ‘win back’ the Working Class. I mention this in passing as it should give pause as to who is pushing this narrative and for what purpose)