Khunanup
Lib Dem
Portsmouth Liberal Democrats
Posts: 11,516
|
Post by Khunanup on Jun 11, 2021 21:59:57 GMT
Derbyshire 2021. C 45 (+8) Lab 14 (-10) LD 4 (-1) Grn 1 (+1). Changes based on 2017: C gain from Lab Alfreton and Somercotes (2) Barlborough and Clowne Clay Cross North Eckington and Killamarsh (2) Ilkeston South South Normanton and Pinxton Sutton Swadlincote North Tibshelf Wirksworth Grn gain from C Duffield and Belper South Lab gain from C Glossop and Charlesworth (1) Whaley Bridge Lab gain from LD New Mills LD gain from C Walton and West LD gain from Lab Loundsley Green and Newbold   Split divisions in May were: Glossop and Charlesworth: Lab/C Lib Dem +1 not -1? |
|
|
|
Post by andrewteale on Jun 12, 2021 0:20:39 GMT
Clearly I can't read my own writing.
|
|
|
|
Post by hullenedge on Jun 13, 2021 12:15:54 GMT
Swings of 1951:-  Two-party (Steed) swing for seats within eight groups (Blue = above average swing to Con, Light Blue = below average, Red = to Lab). Swing cannot be calculated for 17 seats (candidate patterns, Lib wins etc). As expected the swing was lower in seats that voted Tory in 1950 and the Libs withdrew in 1951 and the opposite in Labour 1950 wins. Steed, Berrington and others have reported that Lib intervention/withdrawal hinders/assists the second placed party candidate:-  The bulk of the Tory gains were in seats where the Libs withdrew. |
|
Harry Hayfield
Green
Cavalier Gentleman (as in 17th century Cavalier)
Posts: 2,757 
|
Post by Harry Hayfield on Jun 13, 2021 13:12:18 GMT
The bulk of the Tory gains were in seats where the Libs withdrew. Just as in 1964, the bulk of the Labour gains came when the Liberals stood. |
|
Deleted
Deleted Member
Posts: 0
|
Post by Deleted on Jun 14, 2021 8:33:06 GMT
|
|
|
|
Post by David Ashforth on Jun 15, 2021 9:55:21 GMT
|
|
|
|
Post by minionofmidas on Jun 15, 2021 17:46:12 GMT
A map to celebrate the boundary review. Electorate change, 2000 (cutoff date for last successful review) to 2020 by 2020 districts/UAs, non-Wight England. +7.74% is the overall increase, but on account of the change to the formula +5.00% is what it takes to keep your seat entitlement stable. Worst decline was almost 10% in Blackpool, highest increases in Hackney and Tower Hamlets are over 40%. City of London, not mapped for size reasons, would be in +10-15% band.  |
|
|
|
Post by hullenedge on Jun 15, 2021 19:27:58 GMT
A bit crude but Steed swings of 1992 compared to the 1979 notionals (with the obvious blanks):-  |
|
Deleted
Deleted Member
Posts: 0
|
Post by Deleted on Jun 16, 2021 6:53:42 GMT
Cambridgeshire estimated EU Referendum and 2019 General Election results by Smaller Output Areas (SOAs)
|
|
|
|
Post by Pete Whitehead on Jun 16, 2021 9:14:48 GMT
What is the alleged Conservative voting LSOA near the centre of Cambridge?
|
|
Chris from Brum
Lib Dem
What I need is a strong drink and a peer group.
Posts: 9,166
|
Post by Chris from Brum on Jun 16, 2021 9:29:28 GMT
What is the alleged Conservative voting LSOA near the centre of Cambridge? Peterhouse JCR, probably. |
|
|
|
Post by bjornhattan on Jun 16, 2021 9:40:05 GMT
What is the alleged Conservative voting LSOA near the centre of Cambridge? It looks like the E00167359 Output Area* - which covers Chaucer Road and the Leys School. Most of the population appear to be boarders at the latter. My guess is the method used to predict the winner by locality uses census data and the boarding school has skewed it in some way. For example, qualifications statistics are based on all residents aged 16 or over, so the presence of older boarders with only GCSEs (or equivalent) will reduce the proportion of graduates, and the model may assume this means a stronger Conservative vote. * Confusingly, despite being described as LSOAs, I'm 99% sure they're the smaller output areas instead. |
|
YL
Non-Aligned
Either Labour leaning or Lib Dem leaning but not sure which
Posts: 4,280
|
Post by YL on Jun 16, 2021 10:19:30 GMT
The classification of the referendum results as "Very Remain, "Remain", "Balanced" etc. suggests that the data come from Electoral Calculus, which uses that classification. And entering the Leys School's postcode into EC does indeed show the "Locality" as having voted Tory in all of 2015, 2017 and 2019, and bjornhattan's suggestion of the cause fits with only 54% being shown as having "Good Education", compared with 64% for Cambridge as a whole and 80% for Market ward. |
|
European Lefty
Labour
Can be bribed with salted liquorice
Posts: 5,512
|
Post by European Lefty on Jun 16, 2021 12:44:32 GMT
In other words, it's bollocks then. I have to say I'm sceptical of a lot of these because they tend to use their referendum results to inform their GE results and then act surprised when they get a correlation
|
|
Deleted
Deleted Member
Posts: 0
|
Post by Deleted on Jun 16, 2021 12:59:57 GMT
What is the alleged Conservative voting LSOA near the centre of Cambridge? It looks like the E00167359 Output Area* - which covers Chaucer Road and the Leys School. Most of the population appear to be boarders at the latter. My guess is the method used to predict the winner by locality uses census data and the boarding school has skewed it in some way. For example, qualifications statistics are based on all residents aged 16 or over, so the presence of older boarders with only GCSEs (or equivalent) will reduce the proportion of graduates, and the model may assume this means a stronger Conservative vote. * Confusingly, despite being described as LSOAs, I'm 99% sure they're the smaller output areas instead. Thanks for pointing that out - corrected to say that it's an estimate by SOAs (albeit a flawed one) |
|
|
|
Post by andrewteale on Jun 16, 2021 14:53:29 GMT
Maldon 2019. C 17 (-11) Ind 14 (+12) UKIP 0 (-1). Changes based on 2015: Ind gain from C Burnham-on-Crouch North (1) Burnham-on-Crouch South (2) Heybridge West (2) Maldon East Maldon North (2) Maldon South (2) Maldon West (1) Ind gain from UKIP Althorne (1)   Mayland was uncontested. Split wards in 2019 were: Althorne: Ind/C Burnham-on-Crouch North: Ind/C Southminster: Ind/C
I have made some changes to the LEAP code to convert the pages to HTML5 and improve their appearance on mobile devices. On a desktop, this has had the side effect of making the left-hand navigation bar wider than it was previously.
|
|
Deleted
Deleted Member
Posts: 0
|
Post by Deleted on Jun 17, 2021 10:48:50 GMT
Obviously the Green gains are horseshit, but the map illustrates where the Tories may be vulnerable to tactical voting in the future (boundary changes notwithstanding)
|
|
WJ
Non-Aligned
Posts: 3,089
|
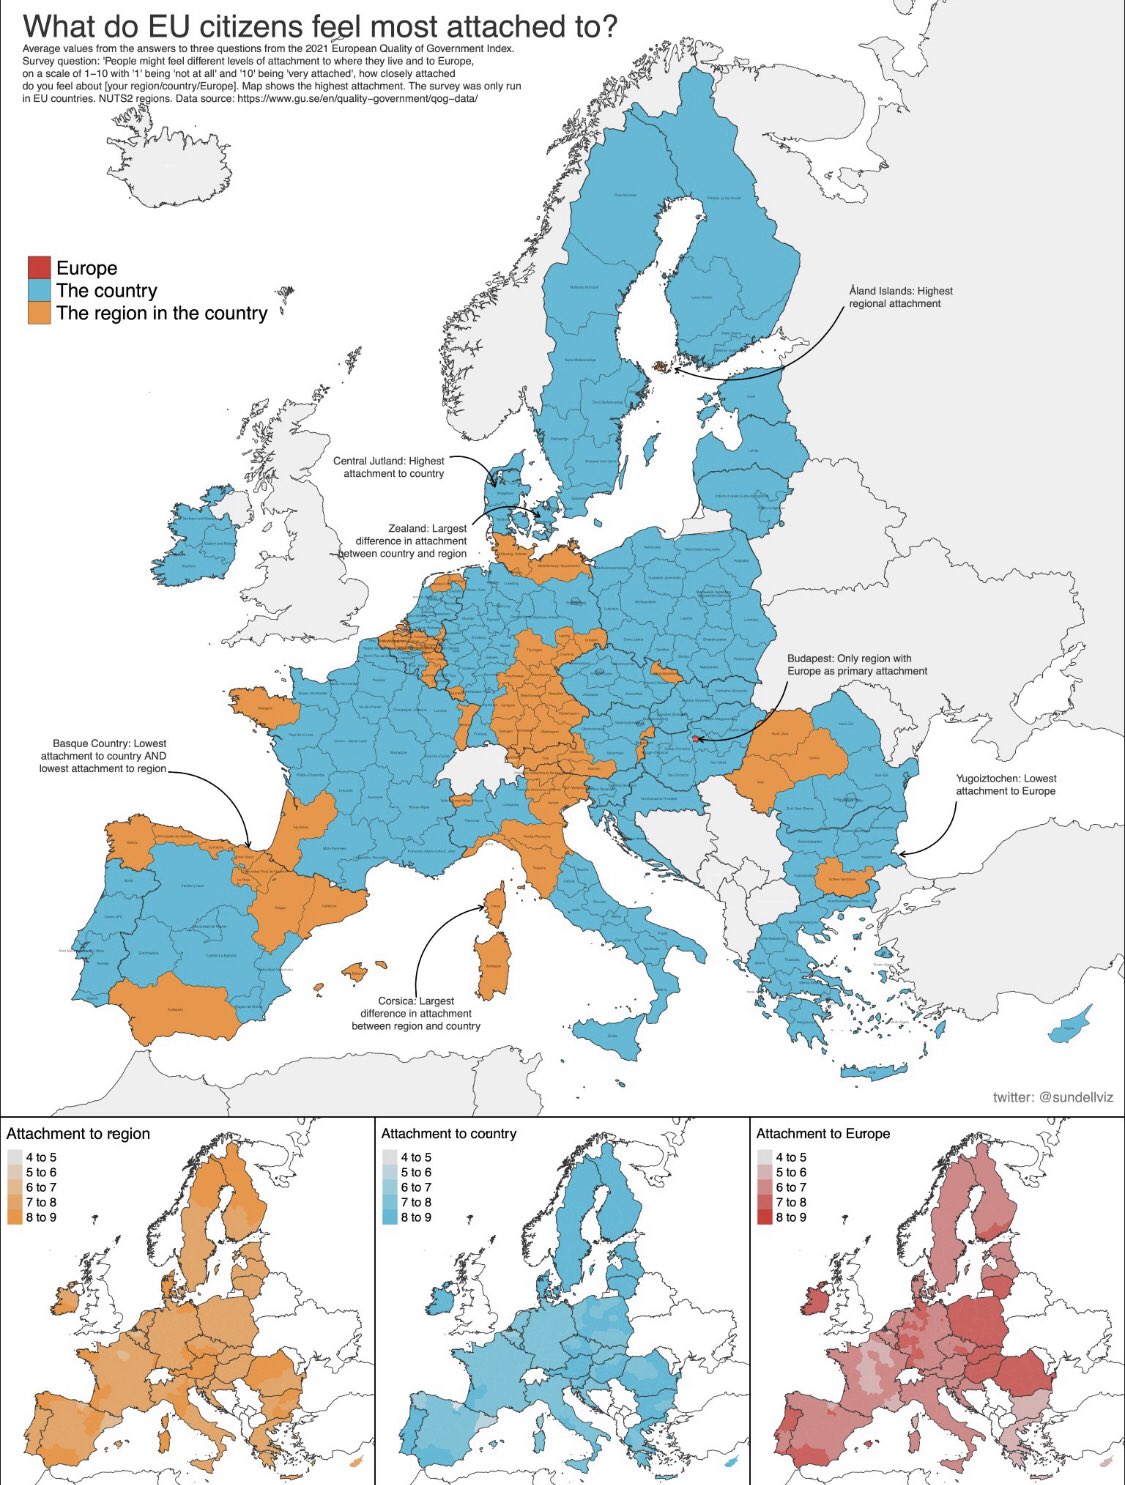
Post by WJ on Jun 17, 2021 11:17:37 GMT
The Basque result is the most interesting thing. I presume it is a dislike of the region as is it drawn that irks Basques the most? Something similar can be seen in Flanders too I think. |
|
Sg1
Conservative
Posts: 778
|
Post by Sg1 on Jun 17, 2021 11:55:36 GMT
Obviously the Green gains are horseshit, but the map illustrates where the Tories may be vulnerable to tactical voting in the future (boundary changes notwithstanding) I actually reckon this makes sense, because obviously the Labour party who hold the equivalent Welsh assembly seat and have come close second or won the seat every time since it's creation are going to roll over and let the green party win the Vale of Glamorgan, and of course the people will vote green and not another party or just abstain based on labour's say so |
|
Deleted
Deleted Member
Posts: 0
|
Post by Deleted on Jun 17, 2021 12:14:33 GMT
Obviously the Green gains are horseshit, but the map illustrates where the Tories may be vulnerable to tactical voting in the future (boundary changes notwithstanding) I actually reckon this makes sense, because obviously the Labour party who hold the equivalent Welsh assembly seat and have come close second or won the seat every time since it's creation are going to roll over and let the green party win the Vale of Glamorgan, and of course the people will vote green and not another party or just abstain based on labour's say so Take out the Green gains and this result seems more plausible. |
|