|
|
Post by David Ashforth on May 6, 2017 11:27:14 GMT
|
|
|
|
Post by David Ashforth on May 6, 2017 11:27:42 GMT
|
|
|
|
Post by David Ashforth on May 6, 2017 11:28:11 GMT
|
|
|
|
Post by David Ashforth on May 6, 2017 11:28:33 GMT
|
|
|
|
Post by David Ashforth on May 6, 2017 11:29:13 GMT
|
|
|
|
Post by David Ashforth on May 6, 2017 11:29:50 GMT
|
|
|
|
Post by David Ashforth on May 6, 2017 11:30:26 GMT
|
|
|
|
Post by Lord Twaddleford on May 6, 2017 13:35:55 GMT
A self-made map of the 2017 election results in my local authority, Conwy:  Independents: Independents: 21 Conservatives: 16 Plaid Cymru: 10 Labour: 8 Liberal Democrats: 4 Total: 59 |
|
|
|
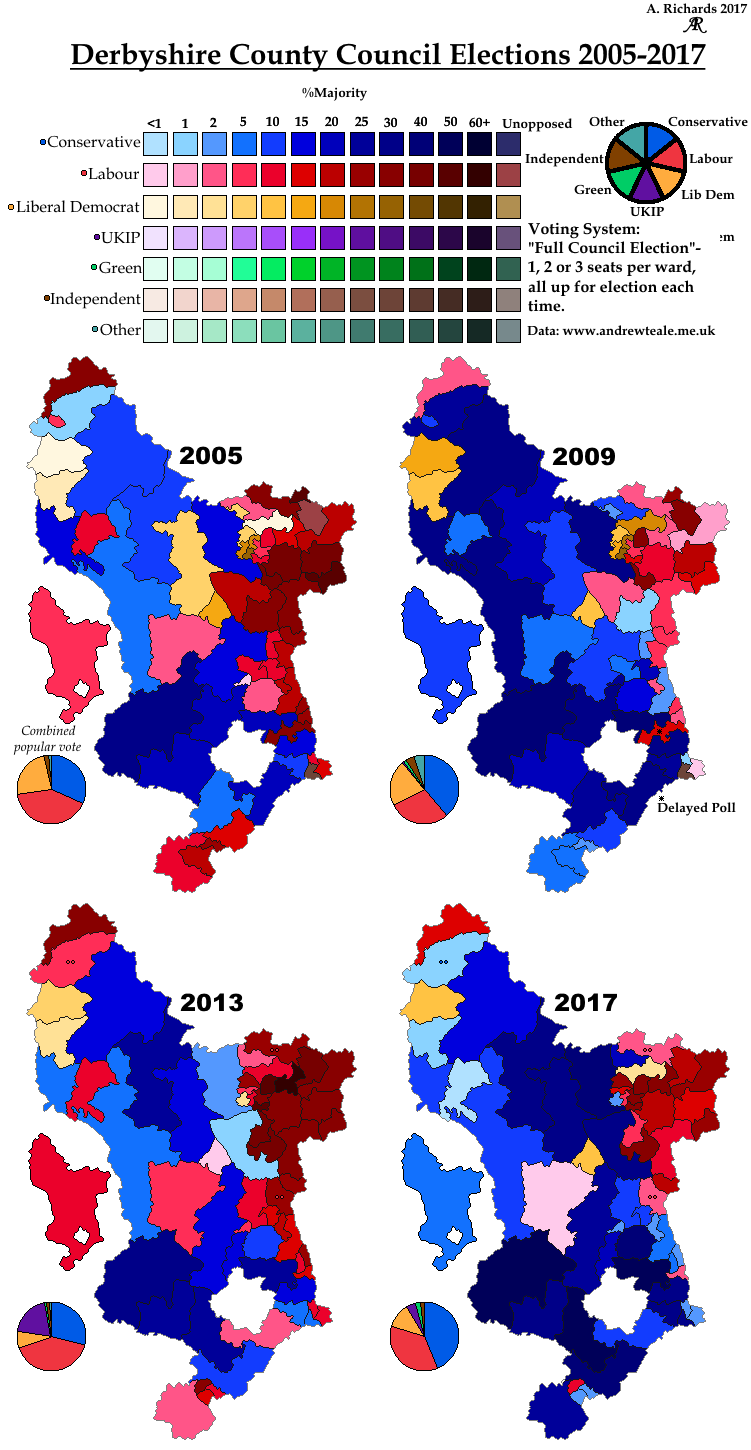
Post by alexrichards on May 6, 2017 16:47:52 GMT
We've started updating our pre-done map series for the County Council maps over on AJR Elections.
Here's Leicestershire and Derbyshire for some interesting contrasts in targeting. 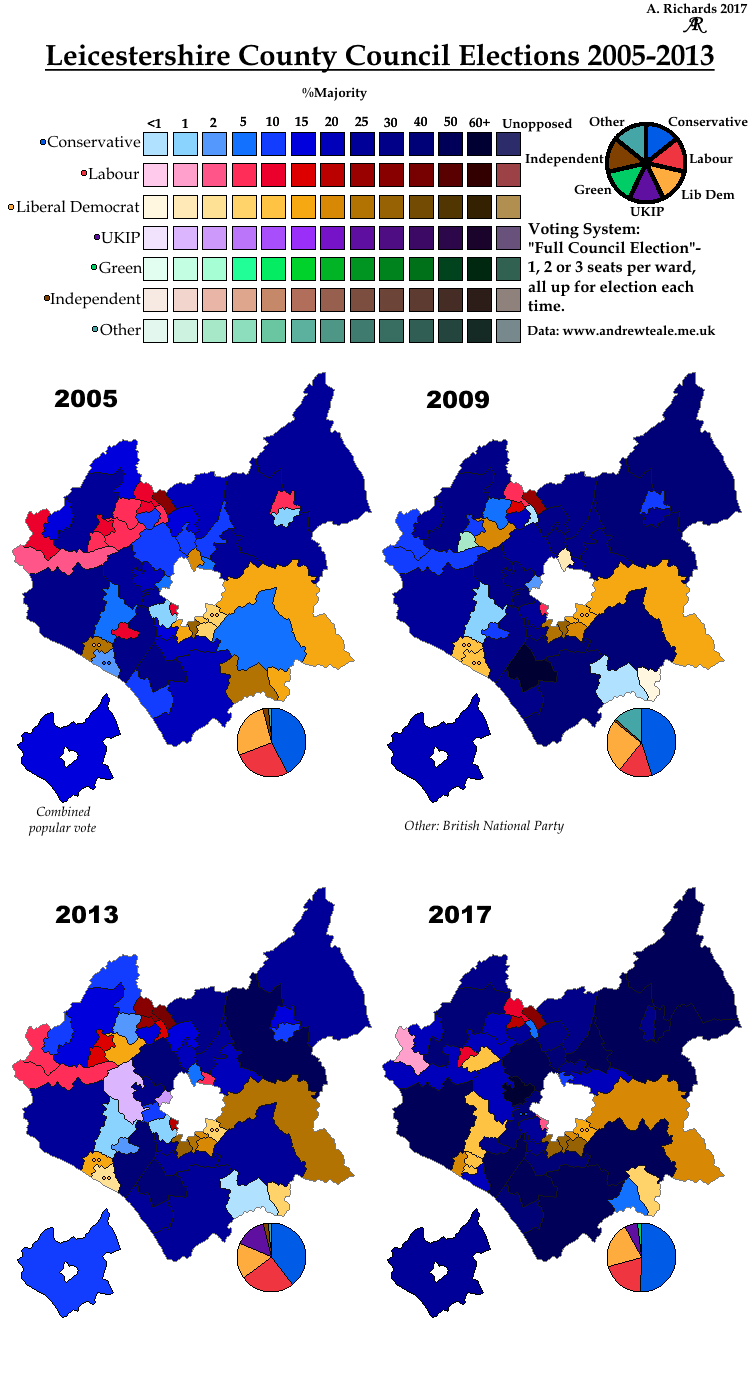
|
|
|
|
Post by lancastrian on May 6, 2017 21:29:50 GMT
Not sure maps of which candidate came first on first preferences are very useful. It would make much morse sense to add the votes of candidates from the same party. The Conservatives got fewer votes than the SNP in all the blue wards except Lower Deeside, and the Tillydrone etc being Labour is because they balanced their vote terribly. |
|
|
|
Post by Pete Whitehead on May 6, 2017 21:41:05 GMT
Not sure maps of which candidate came first on first preferences are very useful. It would make much morse sense to add the votes of candidates from the same party. The Conservatives got fewer votes than the SNP in all the blue wards except Lower Deeside, and the Tillydrone etc being Labour is because they balanced their vote terribly. Is that what they've done? How silly. On that basis Antrim North and Antrim South would have been 'won' by Sinn Fein in the recent NI assembly elections |
|
johnloony
Conservative
Posts: 21,715
Member is Online
|
Post by johnloony on May 6, 2017 22:18:38 GMT
Not sure maps of which candidate came first on first preferences are very useful. It would make much morse sense to add the votes of candidates from the same party. The Conservatives got fewer votes than the SNP in all the blue wards except Lower Deeside, and the Tillydrone etc being Labour is because they balanced their vote terribly. Is that what they've done? How silly. On that basis Antrim North and Antrim South would have been 'won' by Sinn Fein in the recent NI assembly elections No, I presume it shows the party with most votes in the first round, not the candidate. |
|
|
|
Post by lancastrian on May 6, 2017 22:36:03 GMT
Is that what they've done? How silly. On that basis Antrim North and Antrim South would have been 'won' by Sinn Fein in the recent NI assembly elections No, I presume it shows the party with most votes in the first round, not the candidate. Example: Dyce/Bucksburn/Danestone (blue on the above map) CROCKETT, Barney, Aberdeen Labour, making it happen 744 DUTHIE, Coral, Independent 509 LAWRENCE, Graeme Stephen, Aberdeen Labour, making it happen 458 MACGREGOR, Neil, Scottish National Party (SNP) 1,670 MACKENZIE, Avril, Scottish Conservative and Unionist 2,012 PEARCE, Dorothy, Scottish Liberal Democrats 430 SAMARAI, Gill, Scottish National Party (SNP) 785 Top candidate on 1st preferences - Mackenzie, Conservative. Total 1st preferences - SNP 2455 Con 2012 |
|
|
|
Post by andrewteale on May 7, 2017 16:38:42 GMT
|
|
Deleted
Deleted Member
Posts: 0
|
Post by Deleted on May 7, 2017 16:53:53 GMT
Are the Scottish maps above proof that the UK has still not quite got accustomed to propositional electoral systems, with regard to "winners" etc
|
|
|
|
Post by David Ashforth on May 7, 2017 17:00:43 GMT
Are the Scottish maps above proof that the UK has still not quite got accustomed to propositional electoral systems, with regard to "winners" etc Election Maps UK have posted three maps of Edinburgh which is better than their Aberdeen map I posted. |
|
afleitch
SNP
Posts: 3,725  Member is Online
|
Post by afleitch on May 7, 2017 17:05:54 GMT
Since 2007, the maps in Scotland have always been coloured by the party with the largest number of votes (which at that election was in most cases the same as in the actual Holyrood election). The only disagreement whether 'Independents' should be combined, considered a party and considered to have led in wards where their combined votes was greater than that of an actual party (I always went for party strength first)
|
|
|
|
Post by andrewteale on May 8, 2017 12:52:27 GMT
Scottish Borders 2017. C 15 (+5) SNP 9 Ind 8 (+1) LD 2 (-4) Borders Party 0 (-2). Changes based on 2012: C gain from Borders Party Leaderdale and Melrose (1) C gain from Ind East Berwickshire (1) Jedburgh and District (1) C gain from LD Mid Berwickshire (1) C and Ind gain from Borders Party and SNP Galashiels and District (1+1) Ind gain from LD Hawick and Hermitage (1) Tweeddale East (1) SNP gain from LD Selkirkshire (1)   
|
|
|
|
Post by andrewteale on May 10, 2017 16:55:43 GMT
|
|
|
|
Post by manchesterman on May 10, 2017 22:08:41 GMT
I love the fact that theres a place in Hastings called Wishing Tree...marvellous!
|
|


